Overview
Since 1971, Florida has led in supporting college transfer students through its 2+2 transfer pathway system. Florida’s Statewide Articulation Agreement, the 2+2 college-to-university pathway, provides associate in arts (AA) graduates from any of the 28 Florida College System (FCS) institutions guaranteed admission to at least one of the 12 State University System (SUS) institutions.
Aiding in the transfer process is a statewide course numbering system. For all Florida public institutions, and participating private institutions, courses delivering similar content are given the same prefix and number making it possible for the receiving institution to award credit for equivalent courses completed.
Florida has taken several actions to strengthen these transfer pathways for students. Since 2013, students earning 30 credit hours toward their AA degree must identify the bachelor’s program they intend to transfer to. This allows for information to be shared of any prerequisites needed for successful and seamless transfer. In 2019, each FCS and SUS institution was tasked with partnering to create enhanced, or targeted, transfer agreements. One example is the FUSE Program at the University of South Florida, which provides graduates from eight different state colleges guaranteed admission in select programs of study. Most recently, the Florida Legislature passed House Bill 1285 creating specialized AA transfer degrees, referred to as SAAT, to improve transfer opportunities for FCS students. The new transfer degree is for specific associate programs that require additional coursework beyond the traditional 60 credits, such as certain STEM majors, before transferring to an SUS institution.
The suite of policies supporting the transfer pathways has resulted in more Floridians having access to SUS institutions. While the Florida College System AA transfer (FCS AA) student population at SUS institutions represents less than a third of the newly enrolled in-state resident student body, transfer students are more diverse, with higher population shares held by both Black and Hispanic students.
Demographics
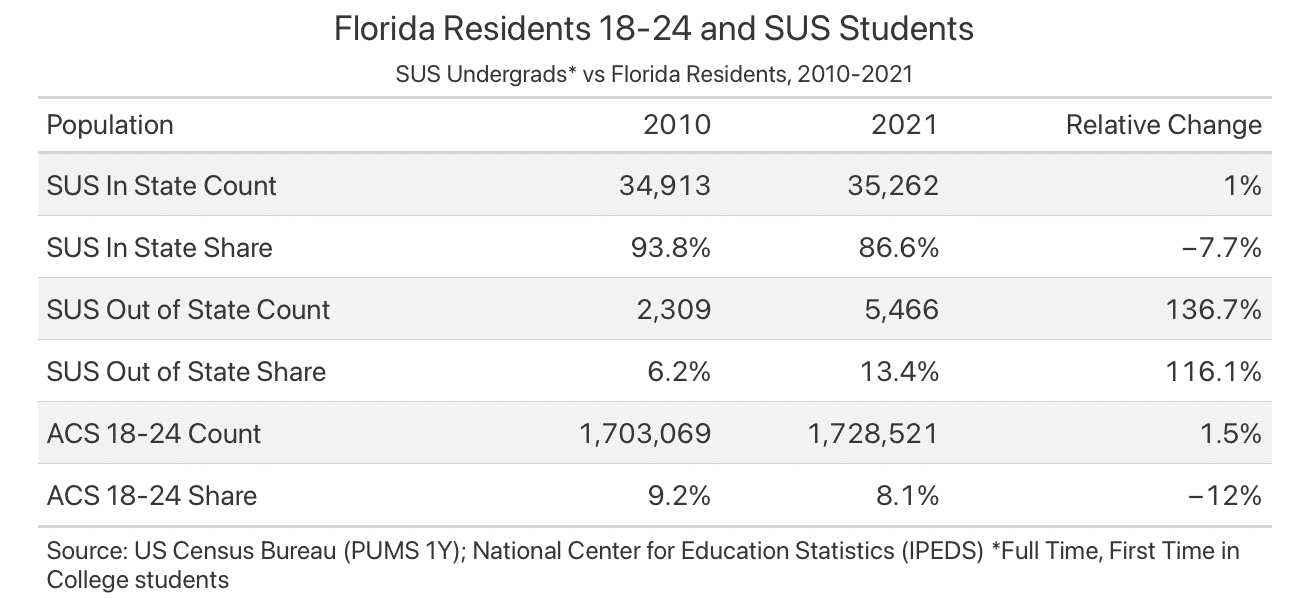
Florida’s largest public universities have recently seen their collective student body transform. Students paying in-state tuition grew from 34,913 to 35,262 between 2010 and 2021 – relative growth of just 1%. In the same period, the population of out-of-state students grew 136% – more than doubling from 2,309 to 5,466. Population shares reflect a similar trend, with an in-state fall of 7.7% from 2010 to 2021 compared to 116% jump in out-of-state share.
These figures are contextualized by the 1.5% growth shown by the 18-24 year old population of Floridians over the same period. Beyond the imbalance between in-state and out-of-state growth, SUS in-state enrollment has fallen behind the state-wide growth of the largest First Time in College (FTIC) age-cohort.
Affordable tuition and ample post-graduate opportunities across the state have rendered Florida’s university system an attractive destination for out-of-state students. As FTIC admission to SUS institutions grows more competitive, the 2+2 pathway becomes a viable option for Floridians aiming to obtain their bachelor’s degree at an SUS institution.
- From 2012 to 2022 the share of White SUS students decreased from over 50% to just above 40% (NCES). While Black students remained stable at approximately 13%, Hispanic students of any race nearly doubled their share of SUS undergraduates since 2004, rising from 17% to 31% in 2022.
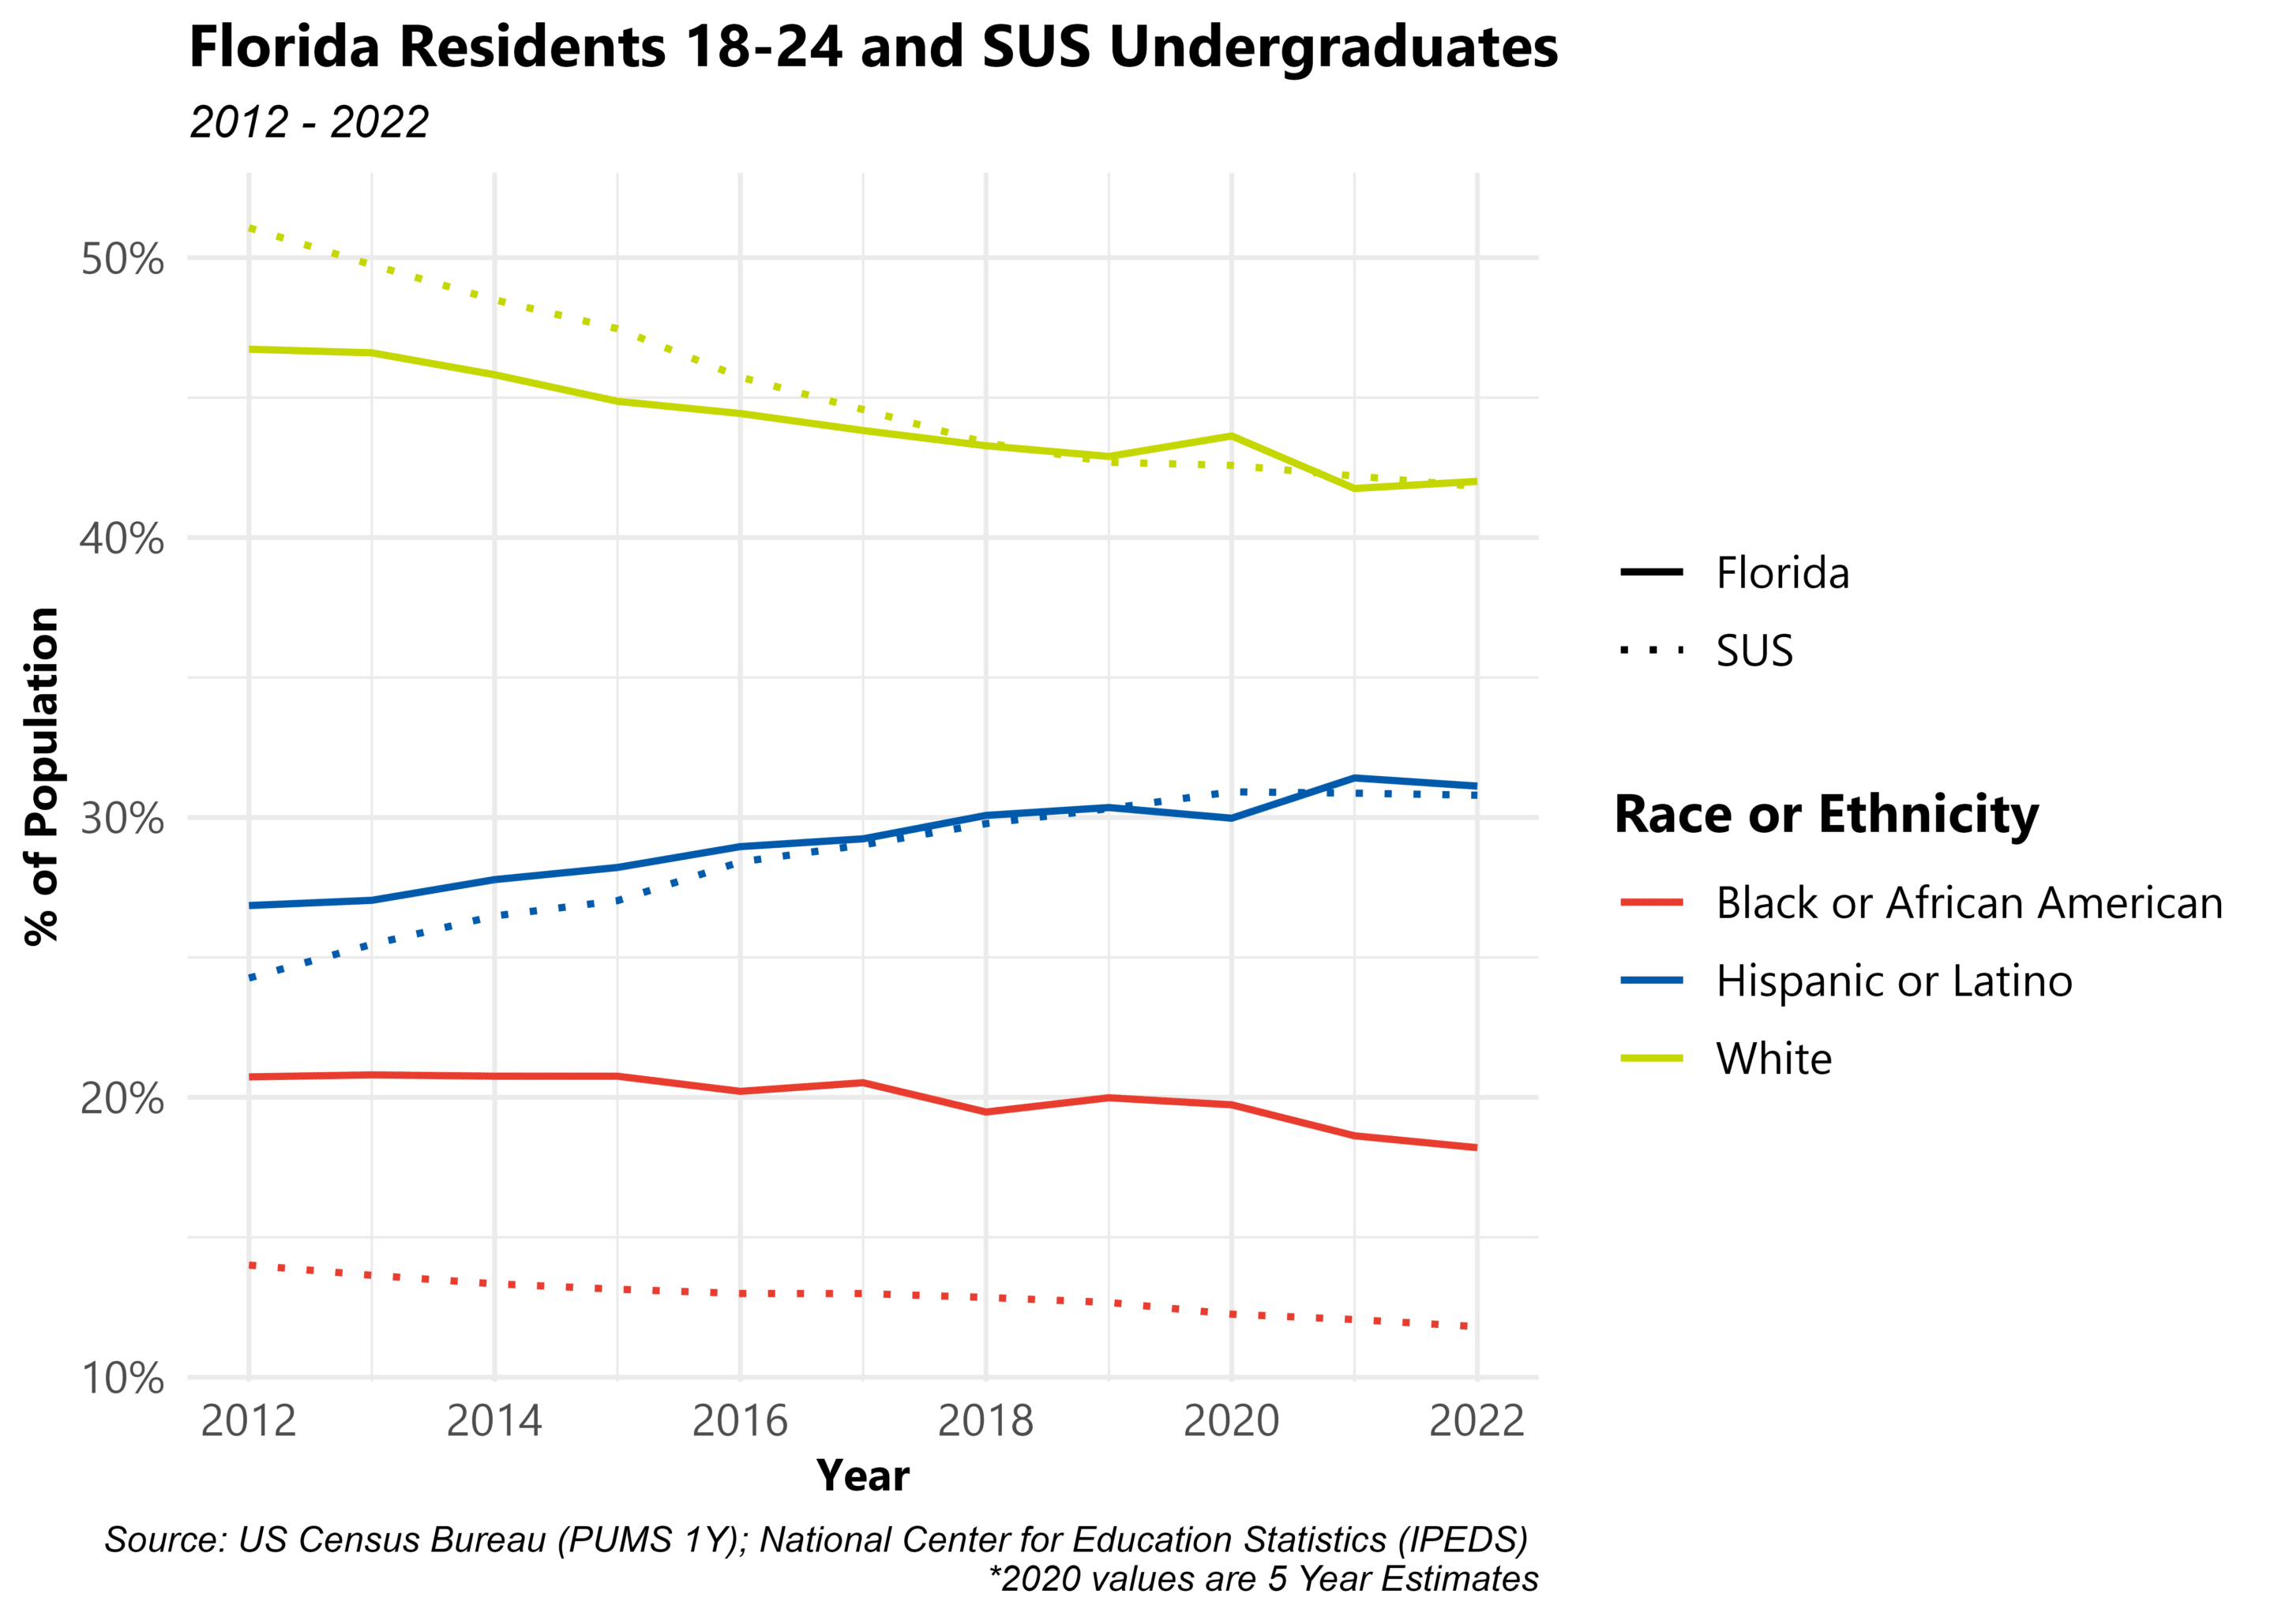

- These shifts follow the overall trends for 18-24 year olds living in the state, reported by U.S. Census, ultimately revealing Black students as the most underrepresented at SUS schools over the 10 year period.
- Exploring the transfer population of in-state students at SUS institutions confirms the successes of the 2+2 system, showing the diversity of the FCS AA student body with Floridians of all ages and backgrounds taking advantage of this opportunity.
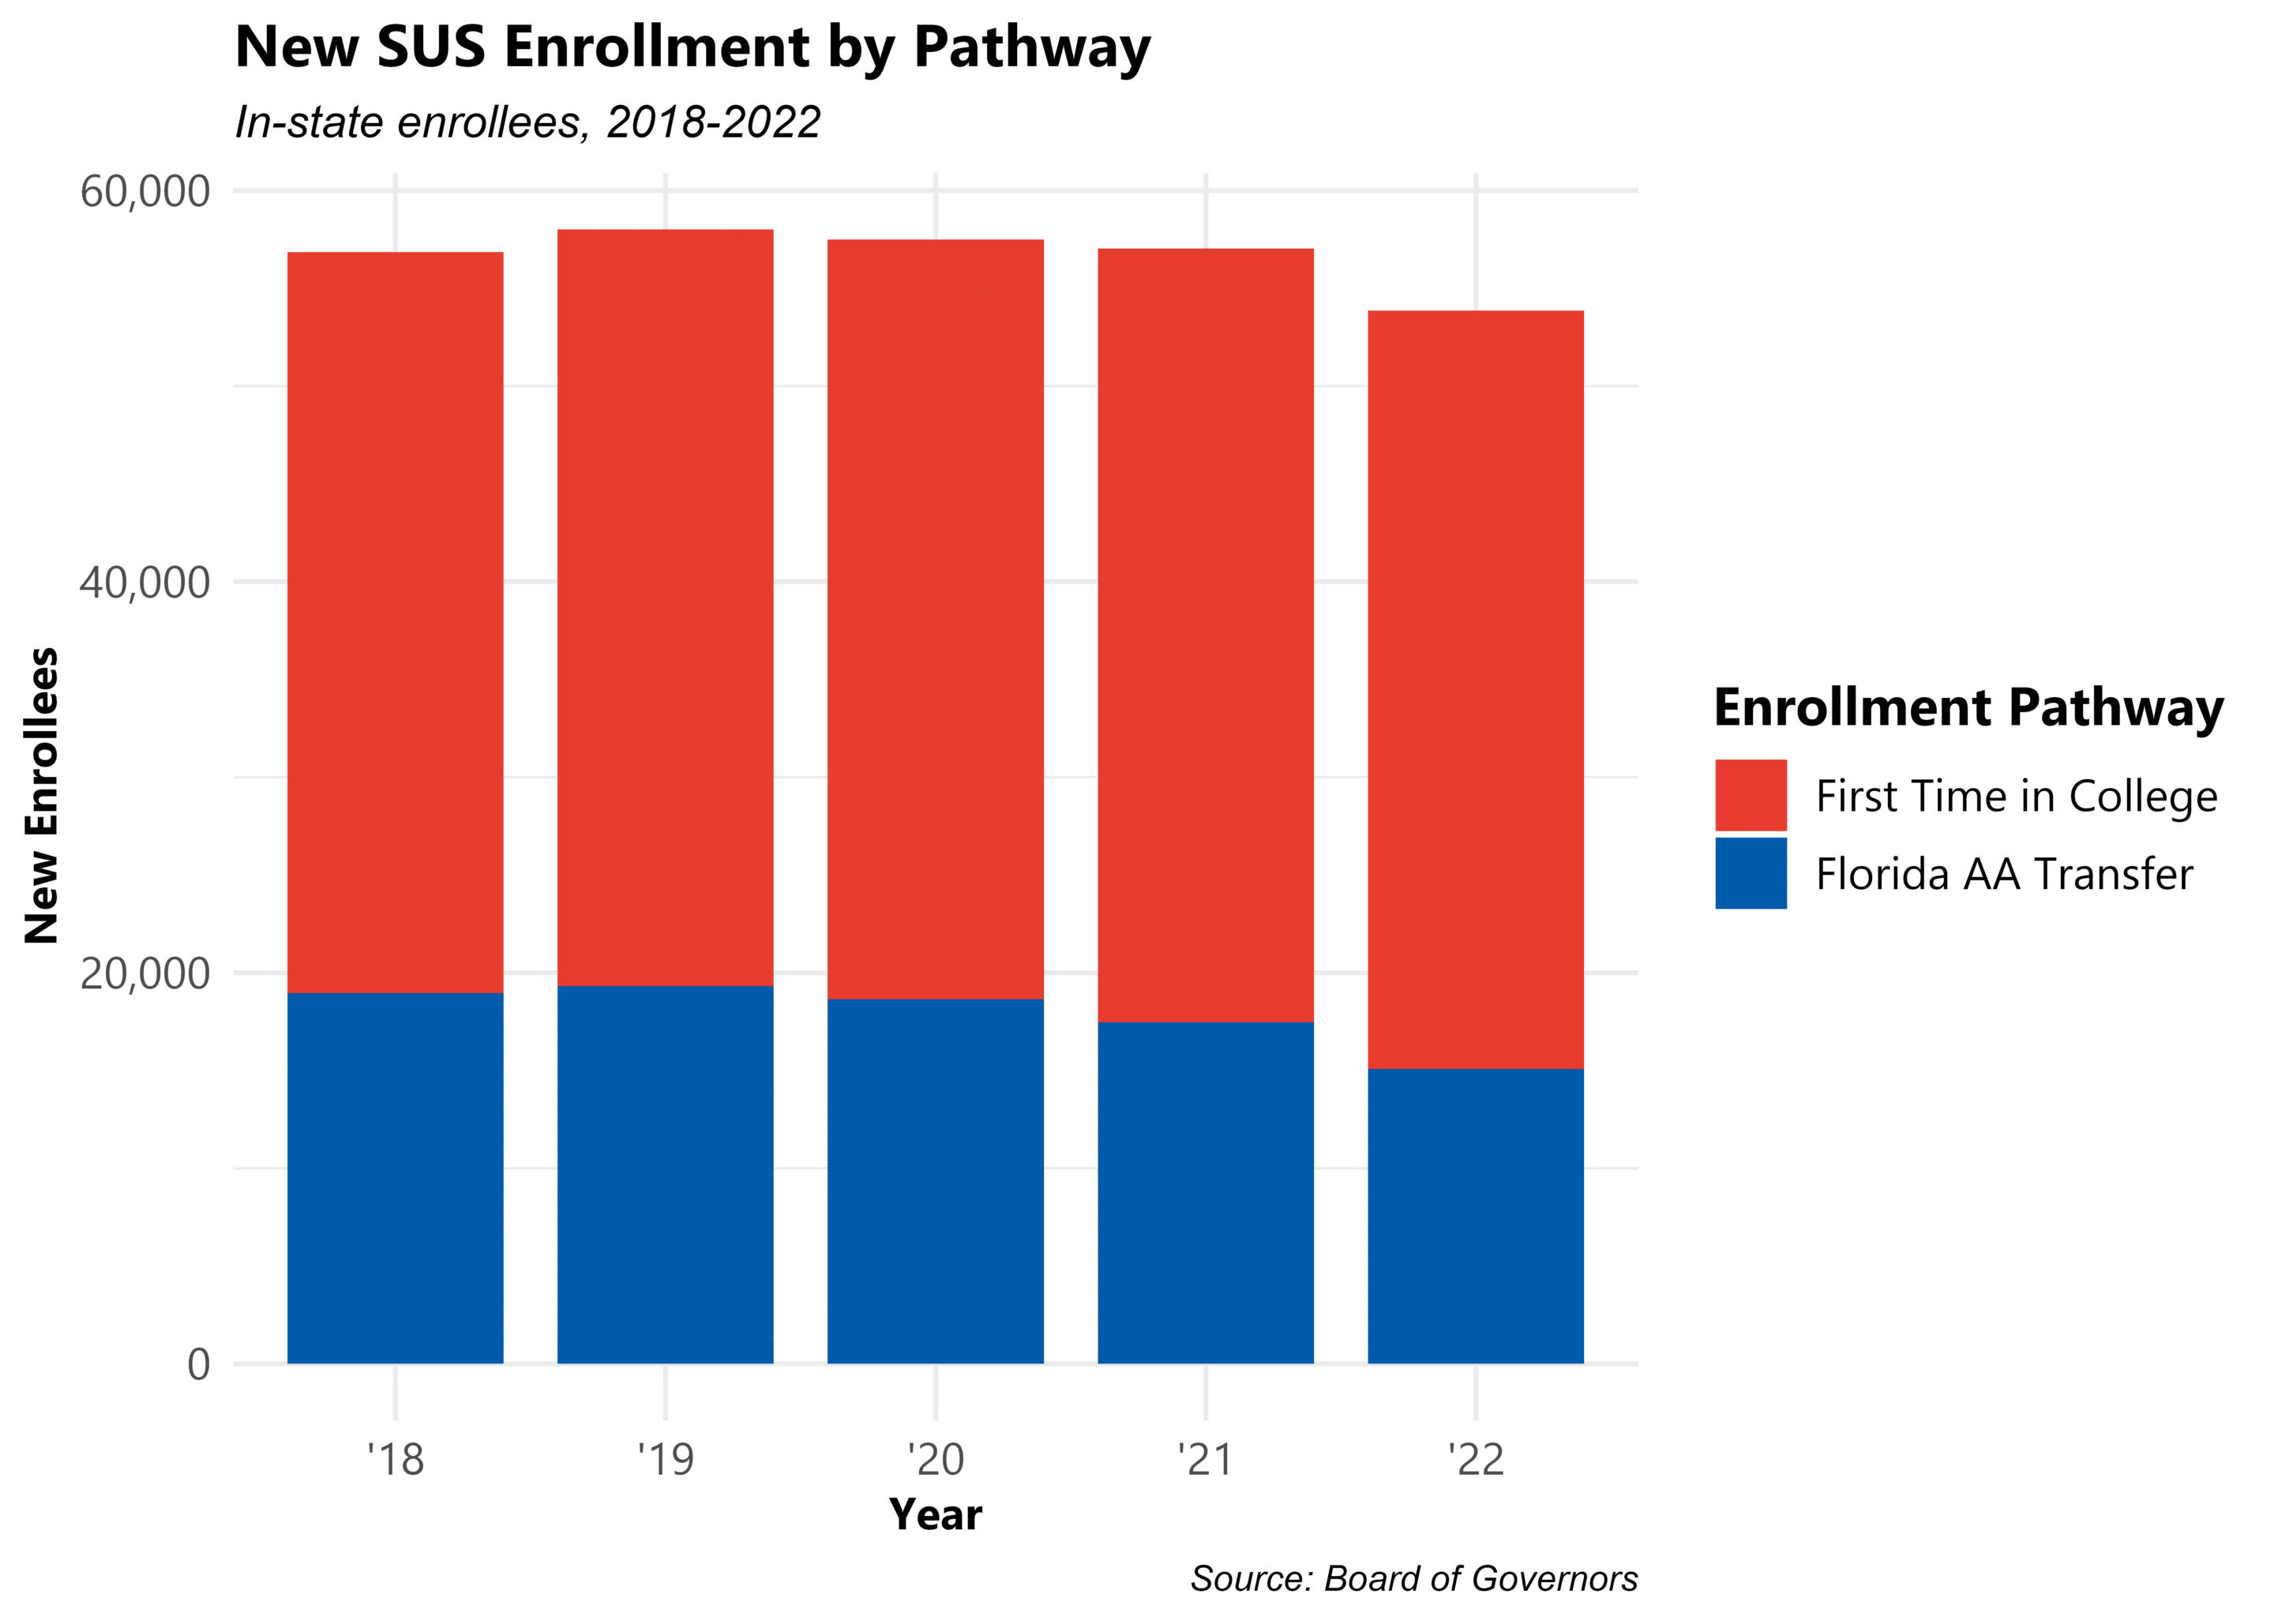
SUS Enrollment: FTIC and FCS AA Transfer
Across SUS institutions, FCS AA Transfer students occupy roughly a third of the nearly 60,000 newly enrolled in-state students. Their share has decreased since the 2020 pandemic.
SUS Enrollment: Race/Ethnicity
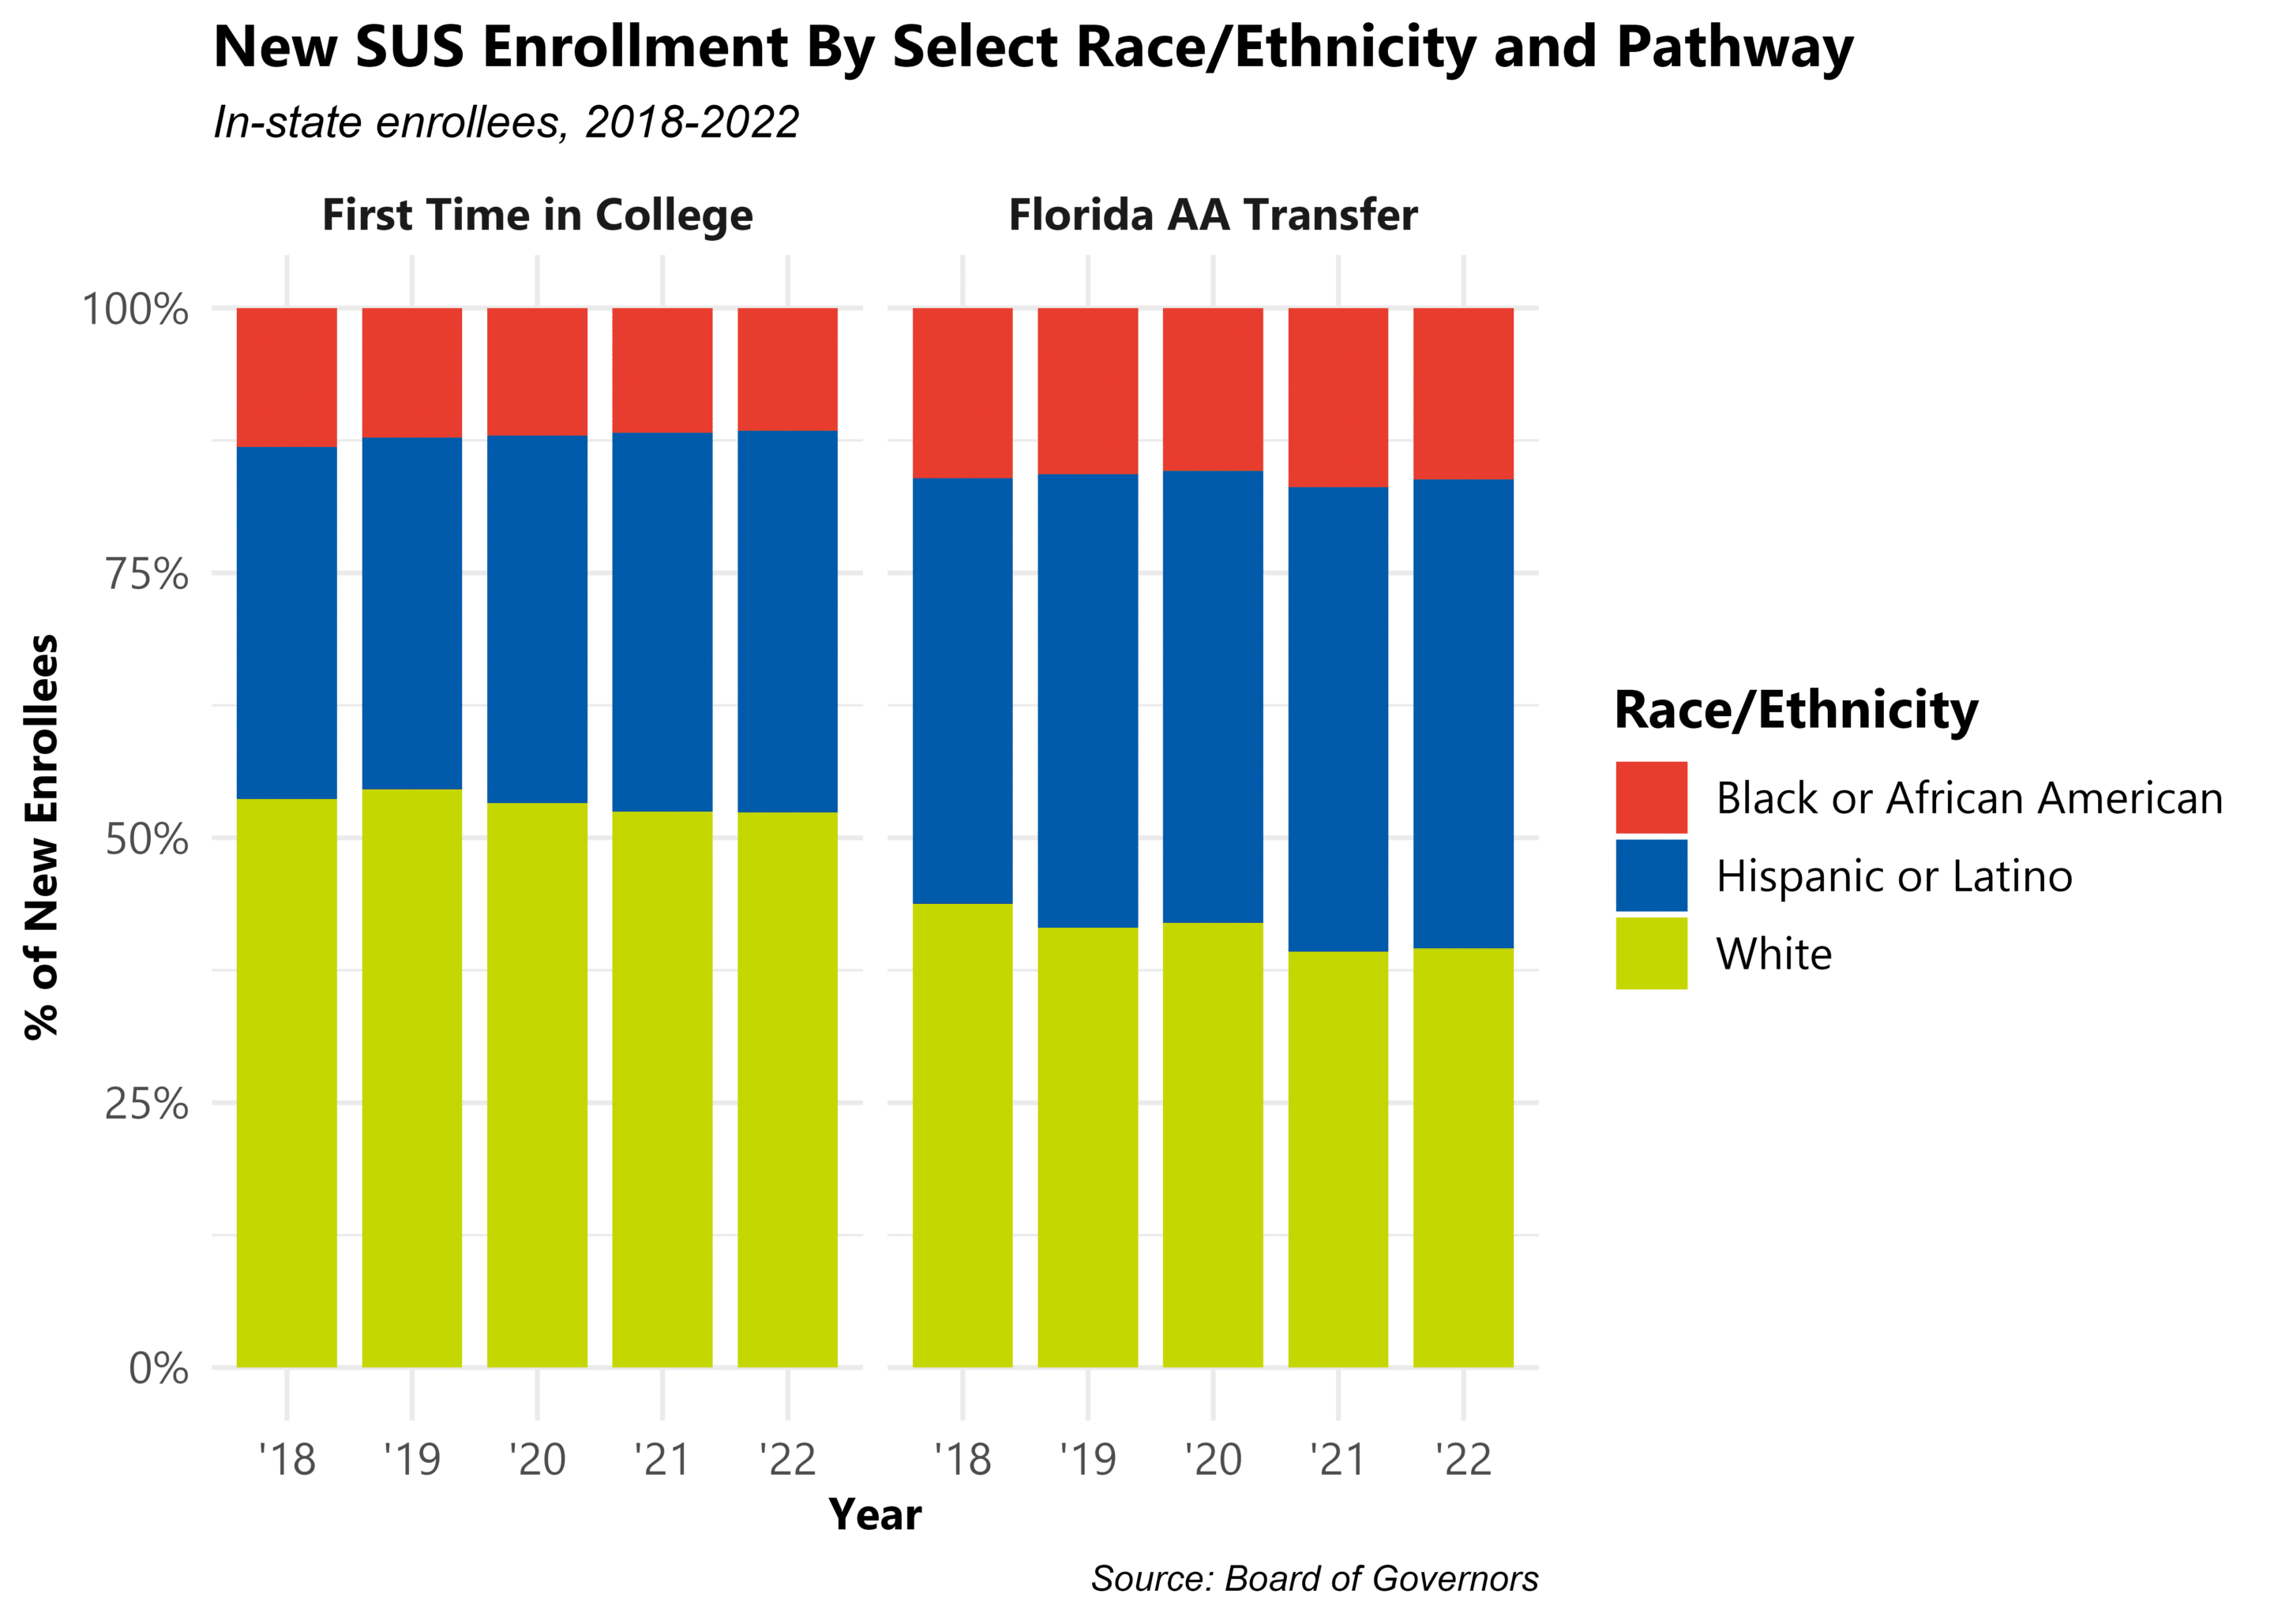
Disaggregating the cohort by race and ethnicity, differences exist between students enrolling in an SUS institution as FTIC students as opposed to FCS AA transfers.
- White students account for over half of the FTIC population throughout the entire evaluation period, over 3 times the share of Black students and over 1.5 times that of Hispanic students of any race.
- This dynamic changes when considering students transferring from an FCS institution. Here, Hispanic students occupy a much larger proportion of the population, representing a slight plurality among the racial/ethnic groups analyzed in the years following 2018
- Black students represent less than 20% of students in both pathway cohorts.

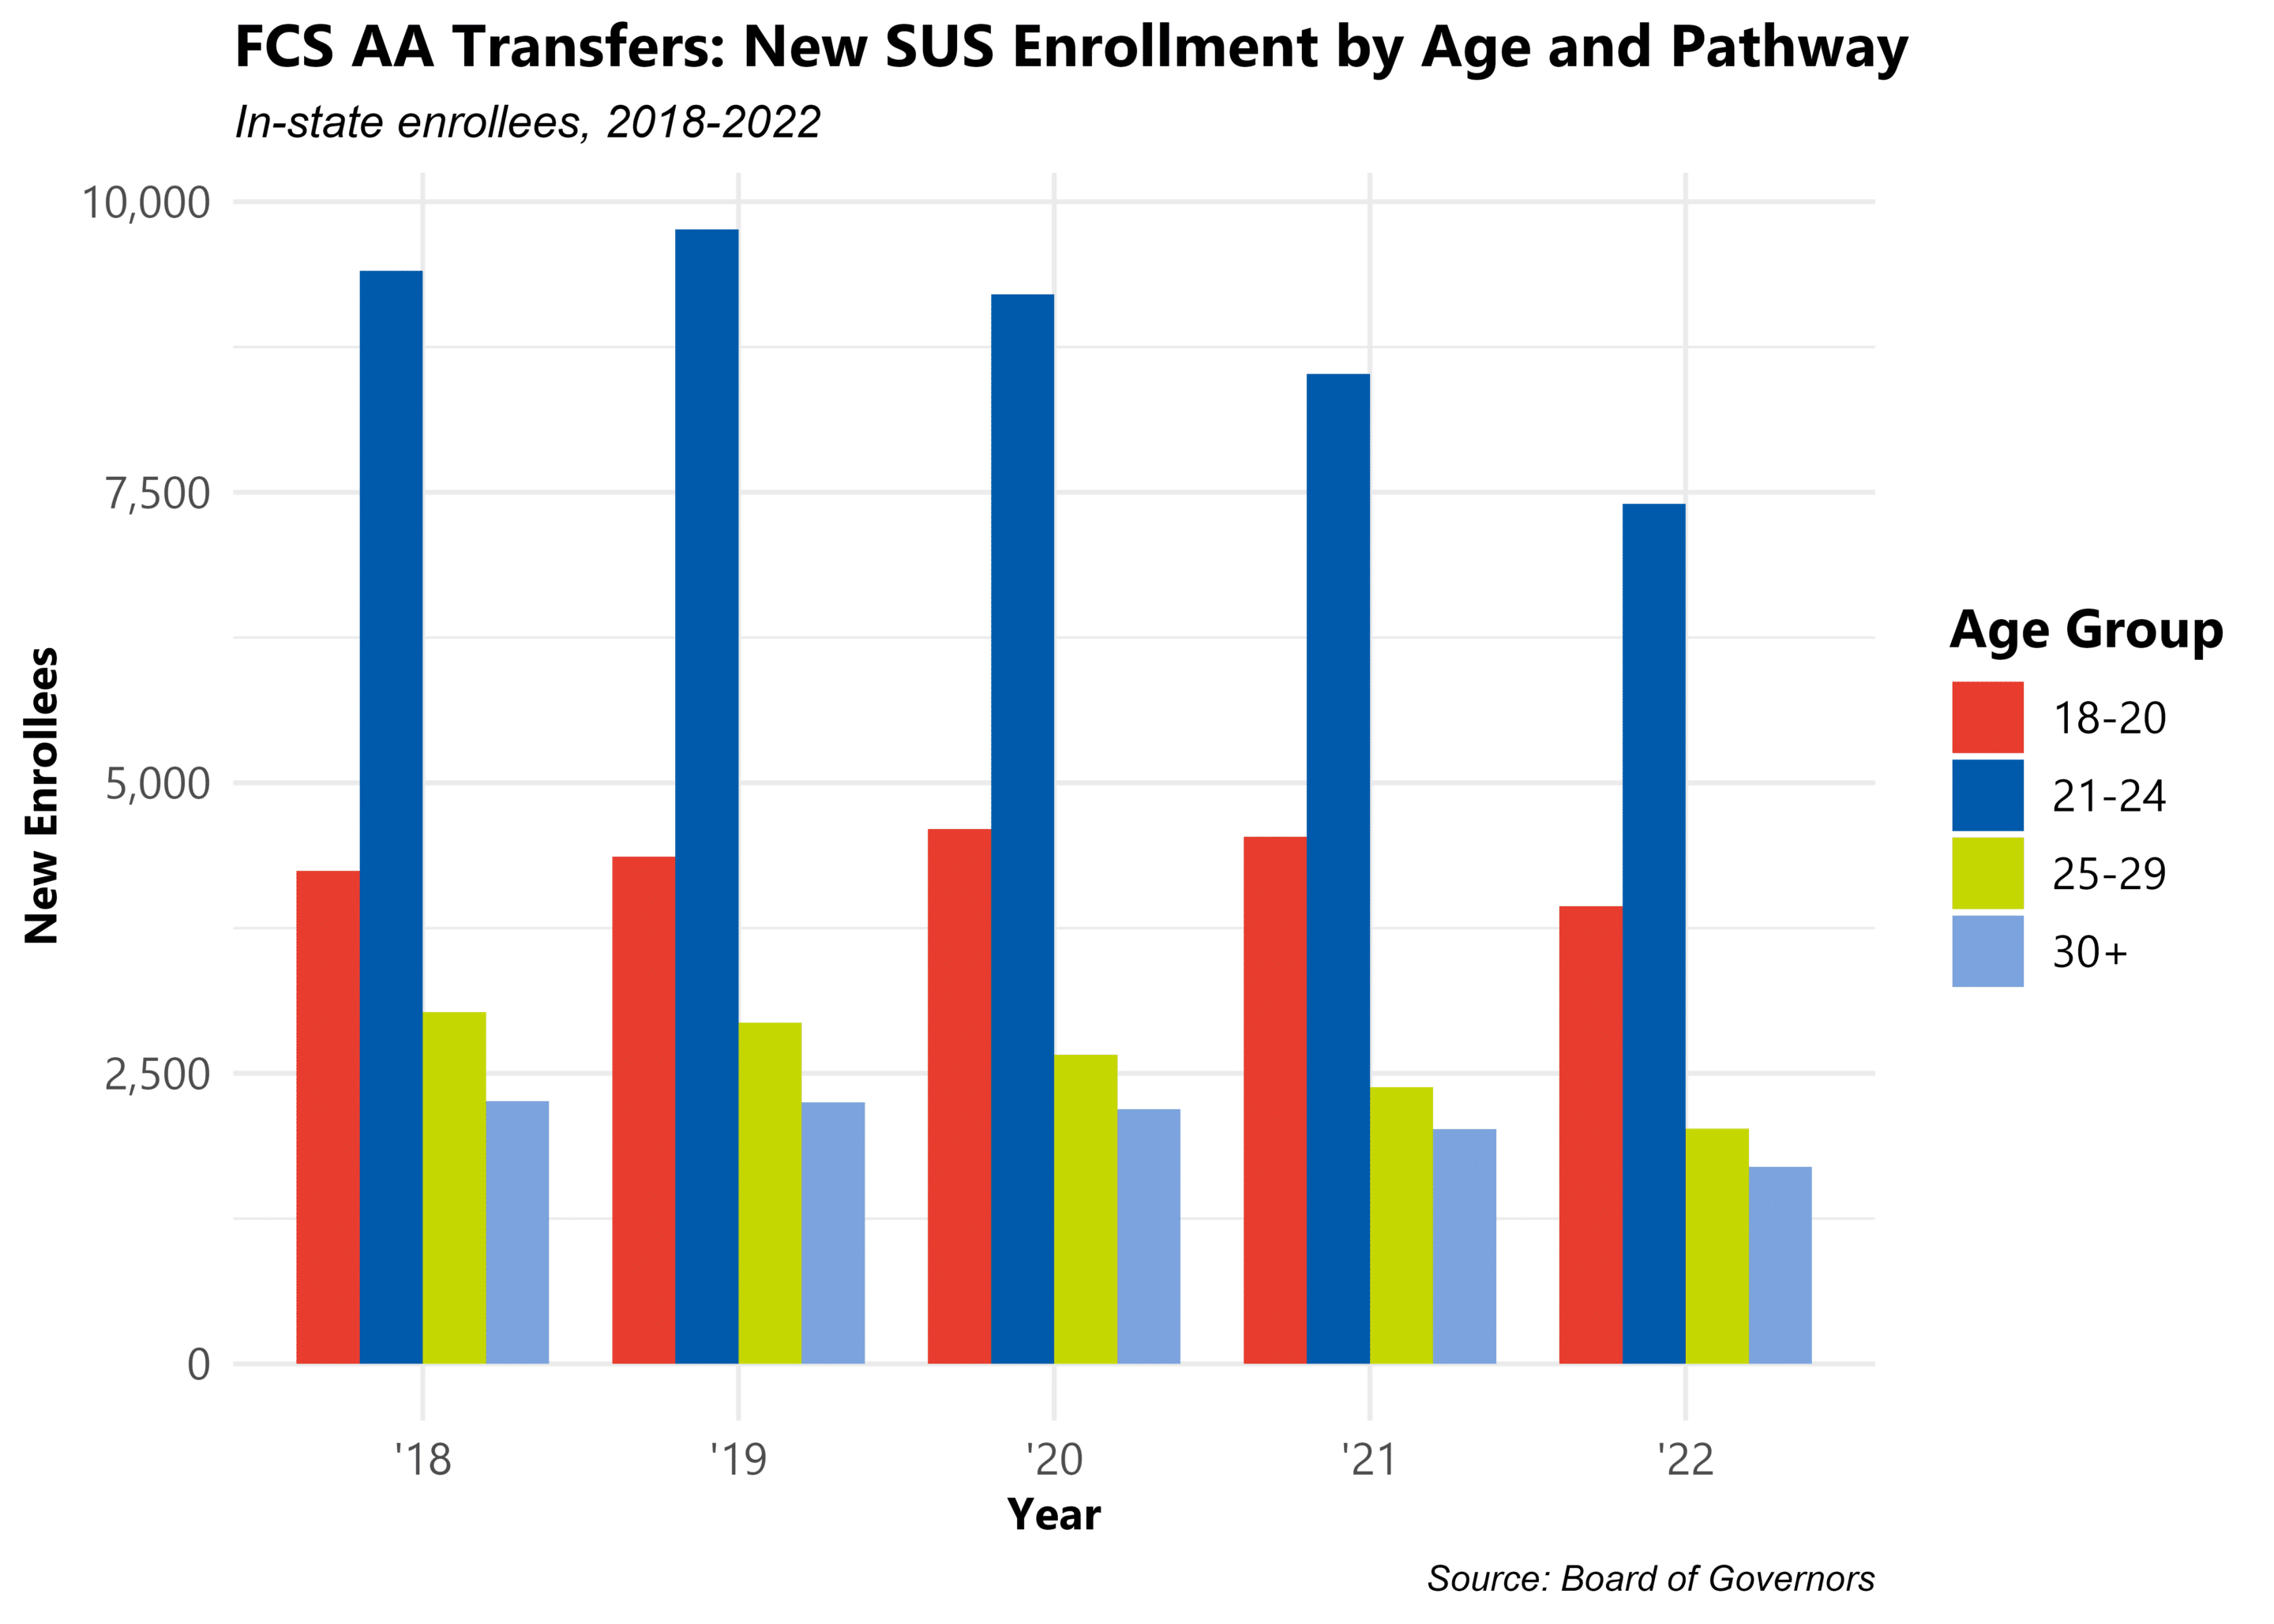
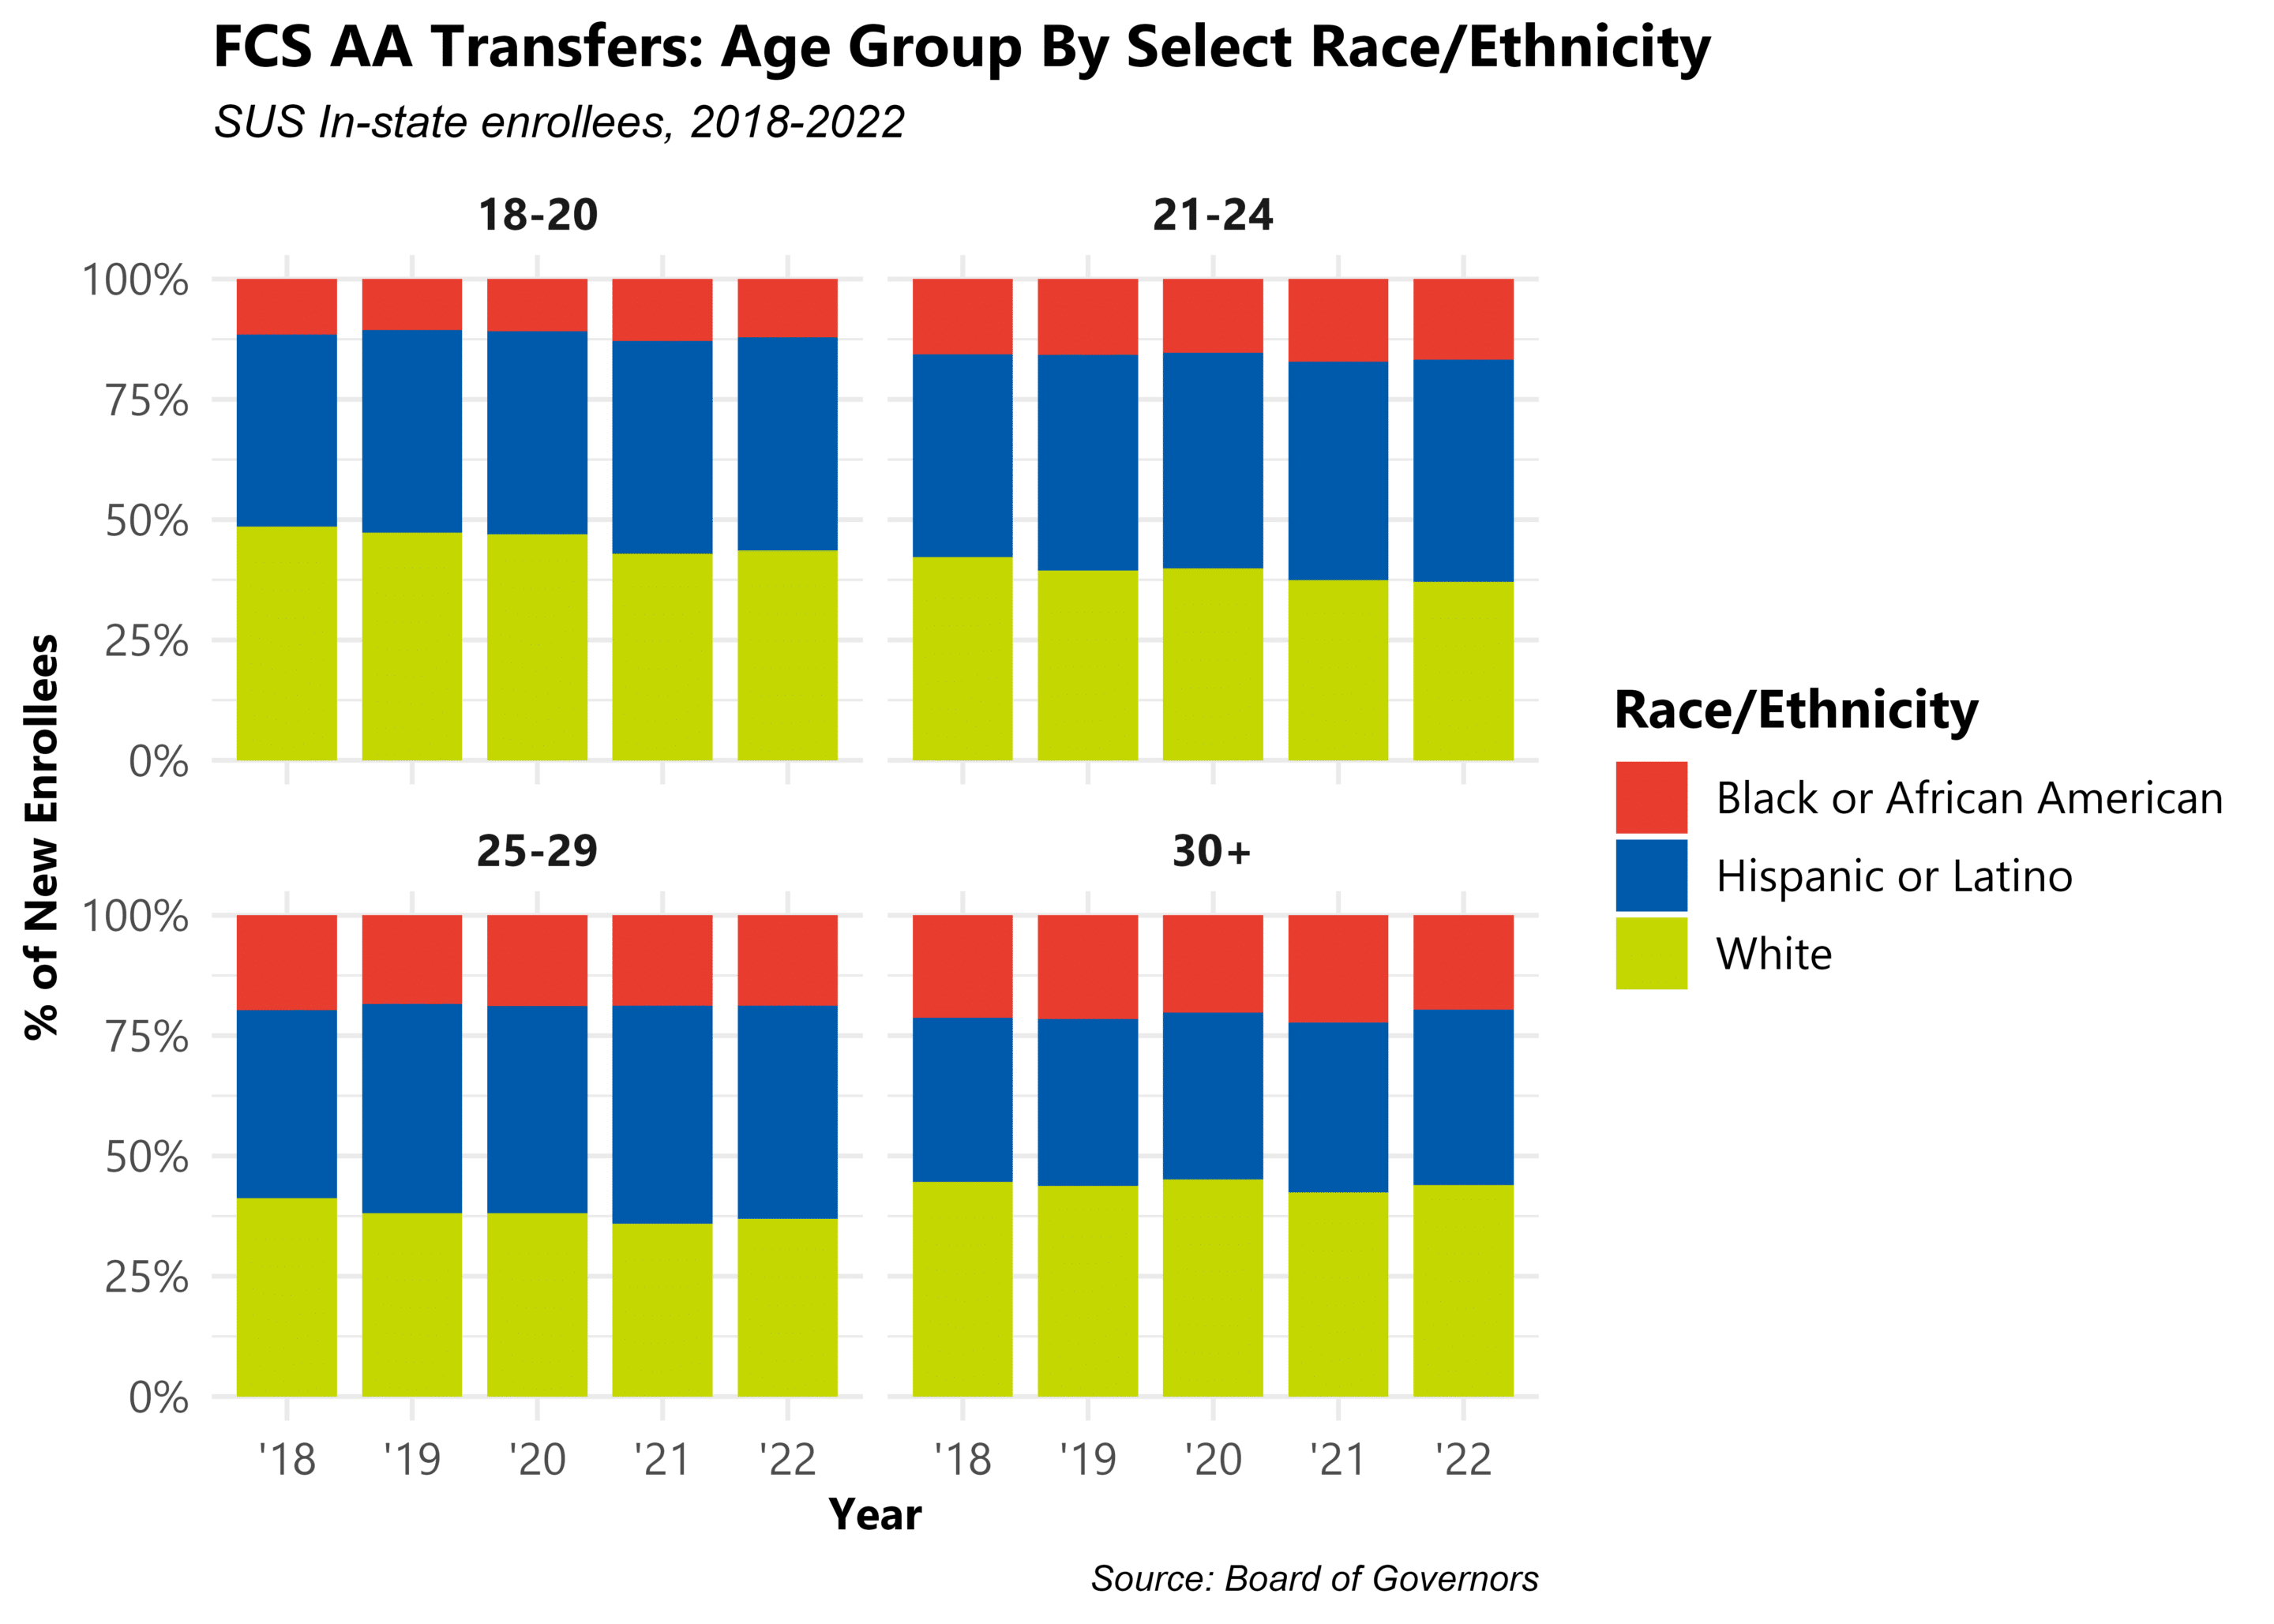
FCS AA Transfer Enrollment: Age
While nearly all FTIC students belong to the 18-20 age group, FCS transfers are typically aged 21-24, having completed their credentials in an FCS institution before entering university.
- In 4 of the 5 evaluation years, the largest represented FCS AA group was Hispanic Women aged 21-24.
- Progressing through age cohorts, the transfer population grows more diverse approaching the 30+ group, while significantly shrinking in size versus the 21-24 age cohort.
A step beyond evaluating SUS Institutions as a whole, undergraduate enrollment figures were used to group the 12 member schools into two cohorts for analysis.
Undergraduate Enrollment Over 25,000
- Florida International University, Florida State University, University of Central Florida, University of Florida, University of South Florida
Undergraduate Enrollment Under 25,000
- Florida A&M University, Florida Atlantic University, Florida Gulf Coast University, Florida Polytechnic University, New College of Florida, University of North Florida, University of West Florida
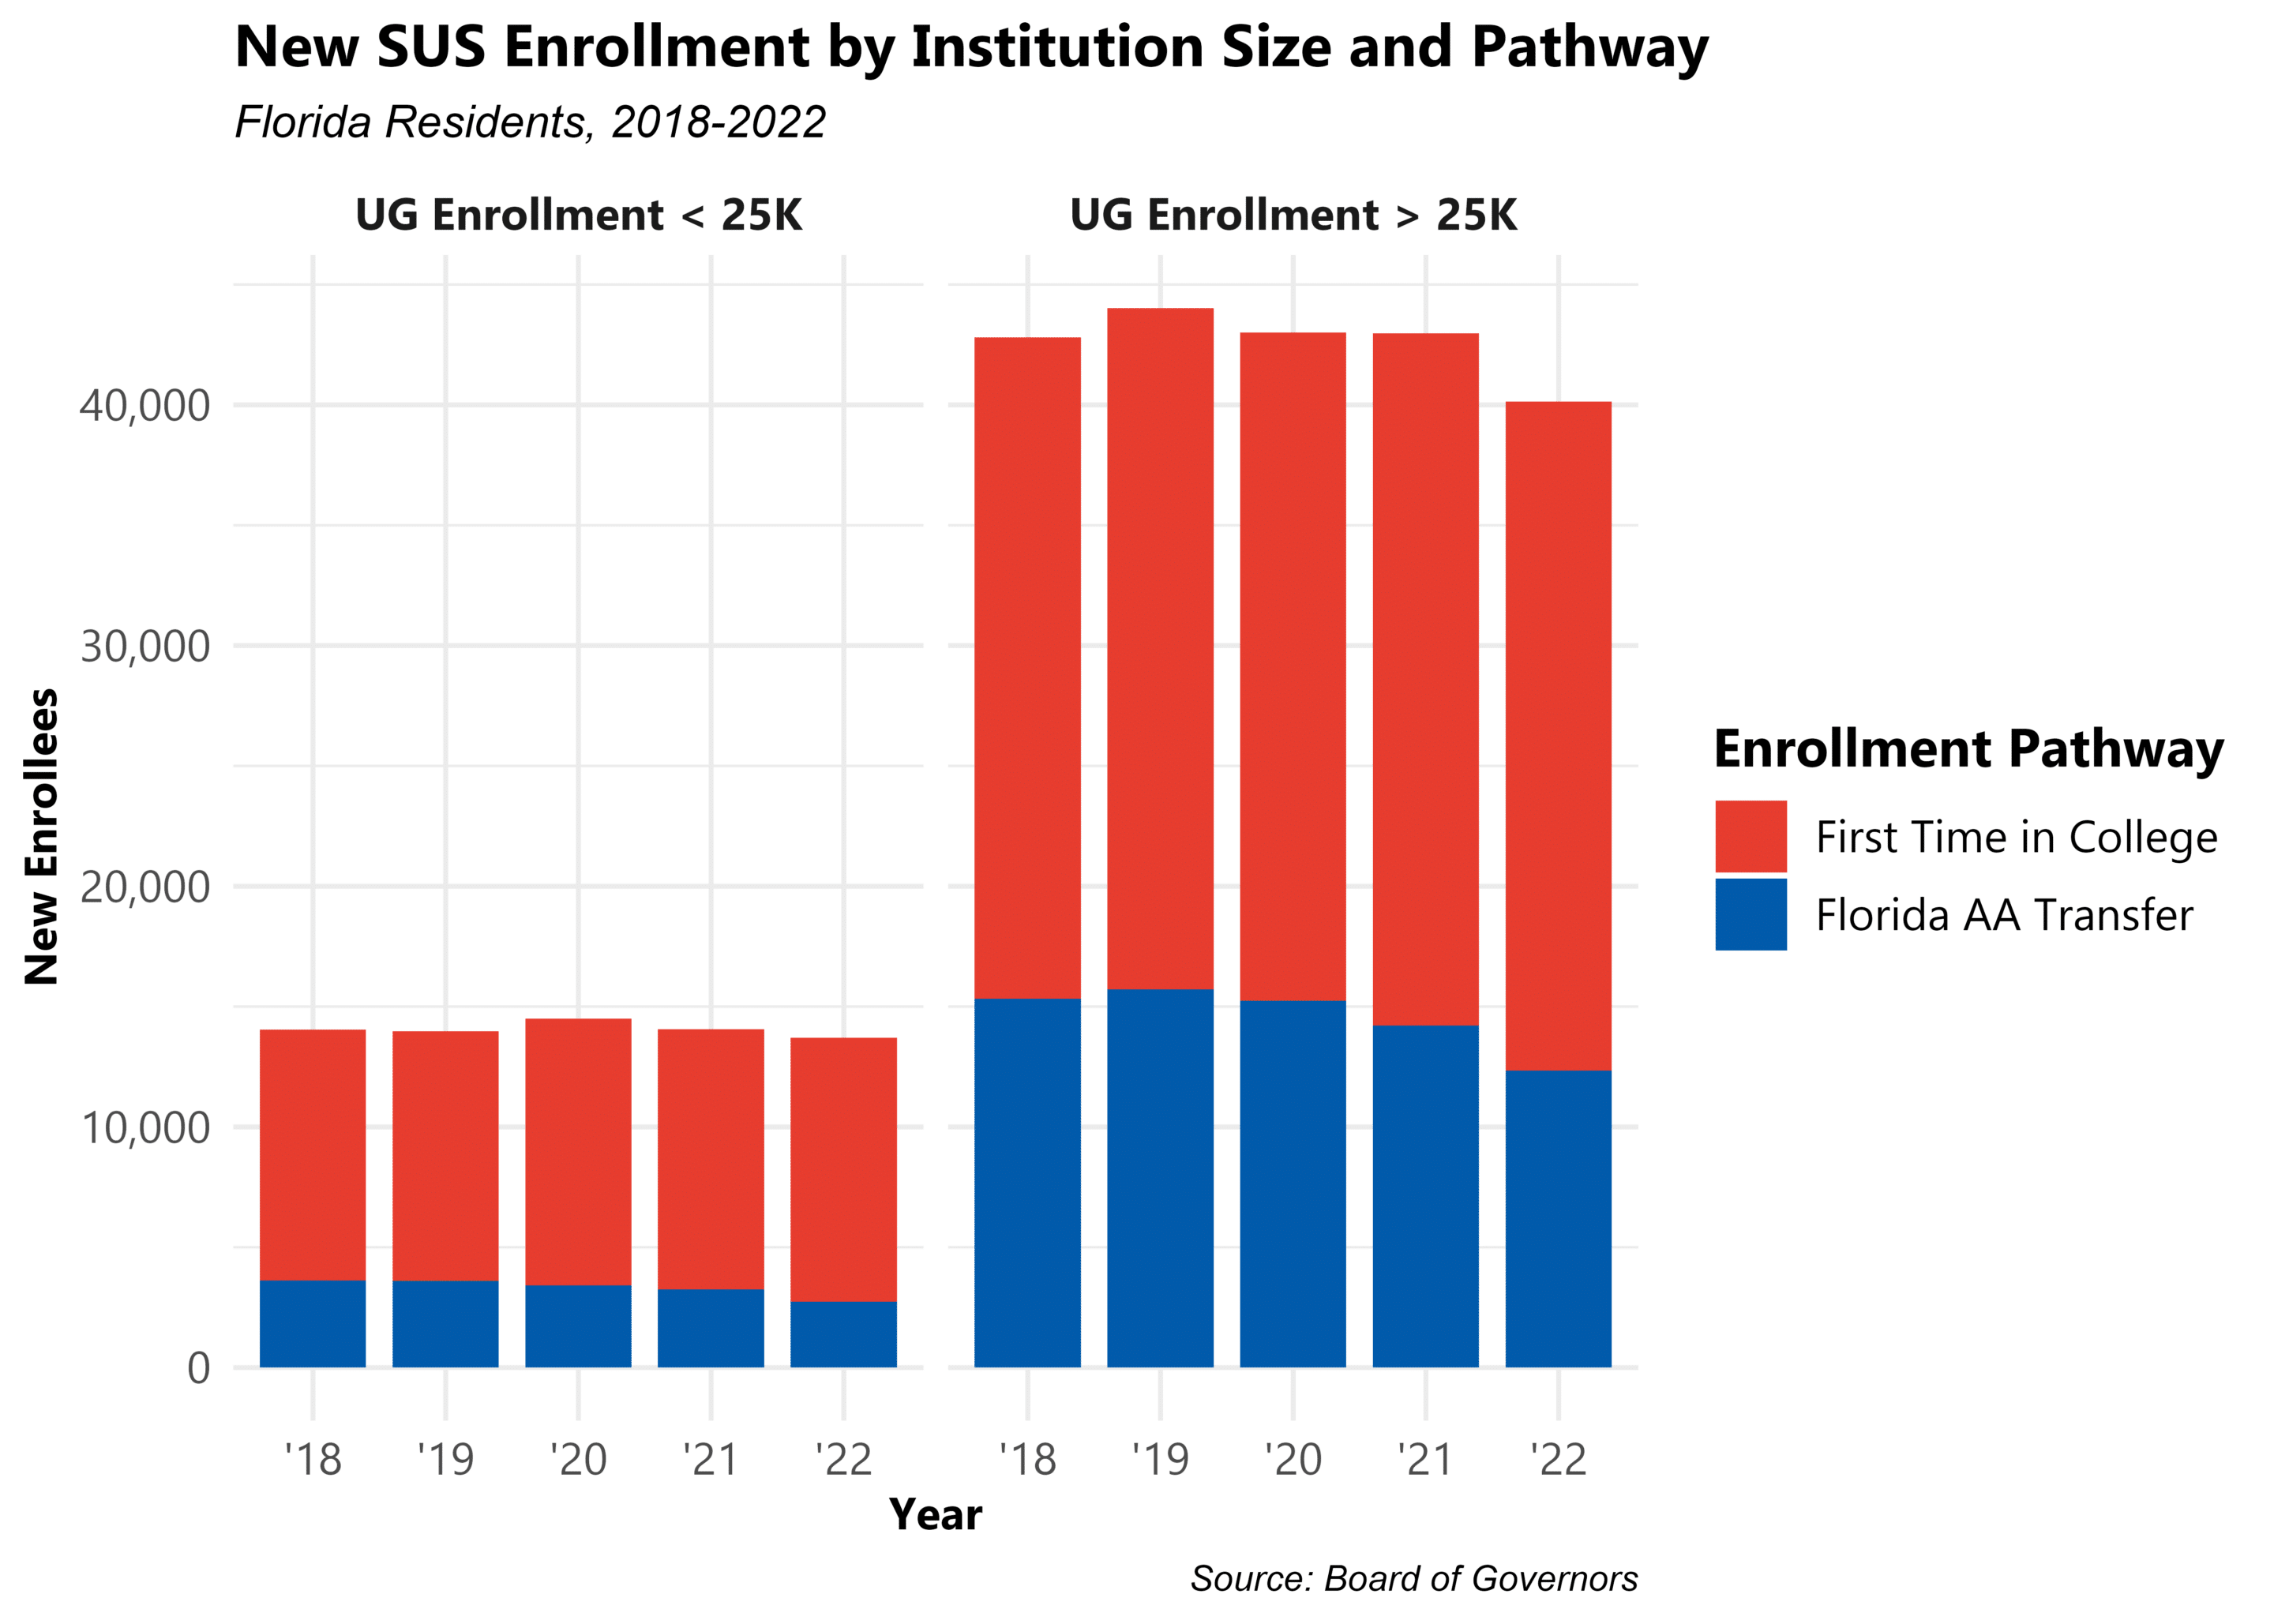
SUS Enrollment: Institution Size and Pathway
The five largest SUS institutions newly enroll almost three times as many resident students as the seven SUS institutions with total undergraduate enrollment less than 25,000.
- FCS AA students represent a larger proportion of newly enrolled in-state students at these five schools, with the transfer share averaging just less than 35% across the 5-year evaluation period in contrast to the remaining schools’ average transfer share of 25% .
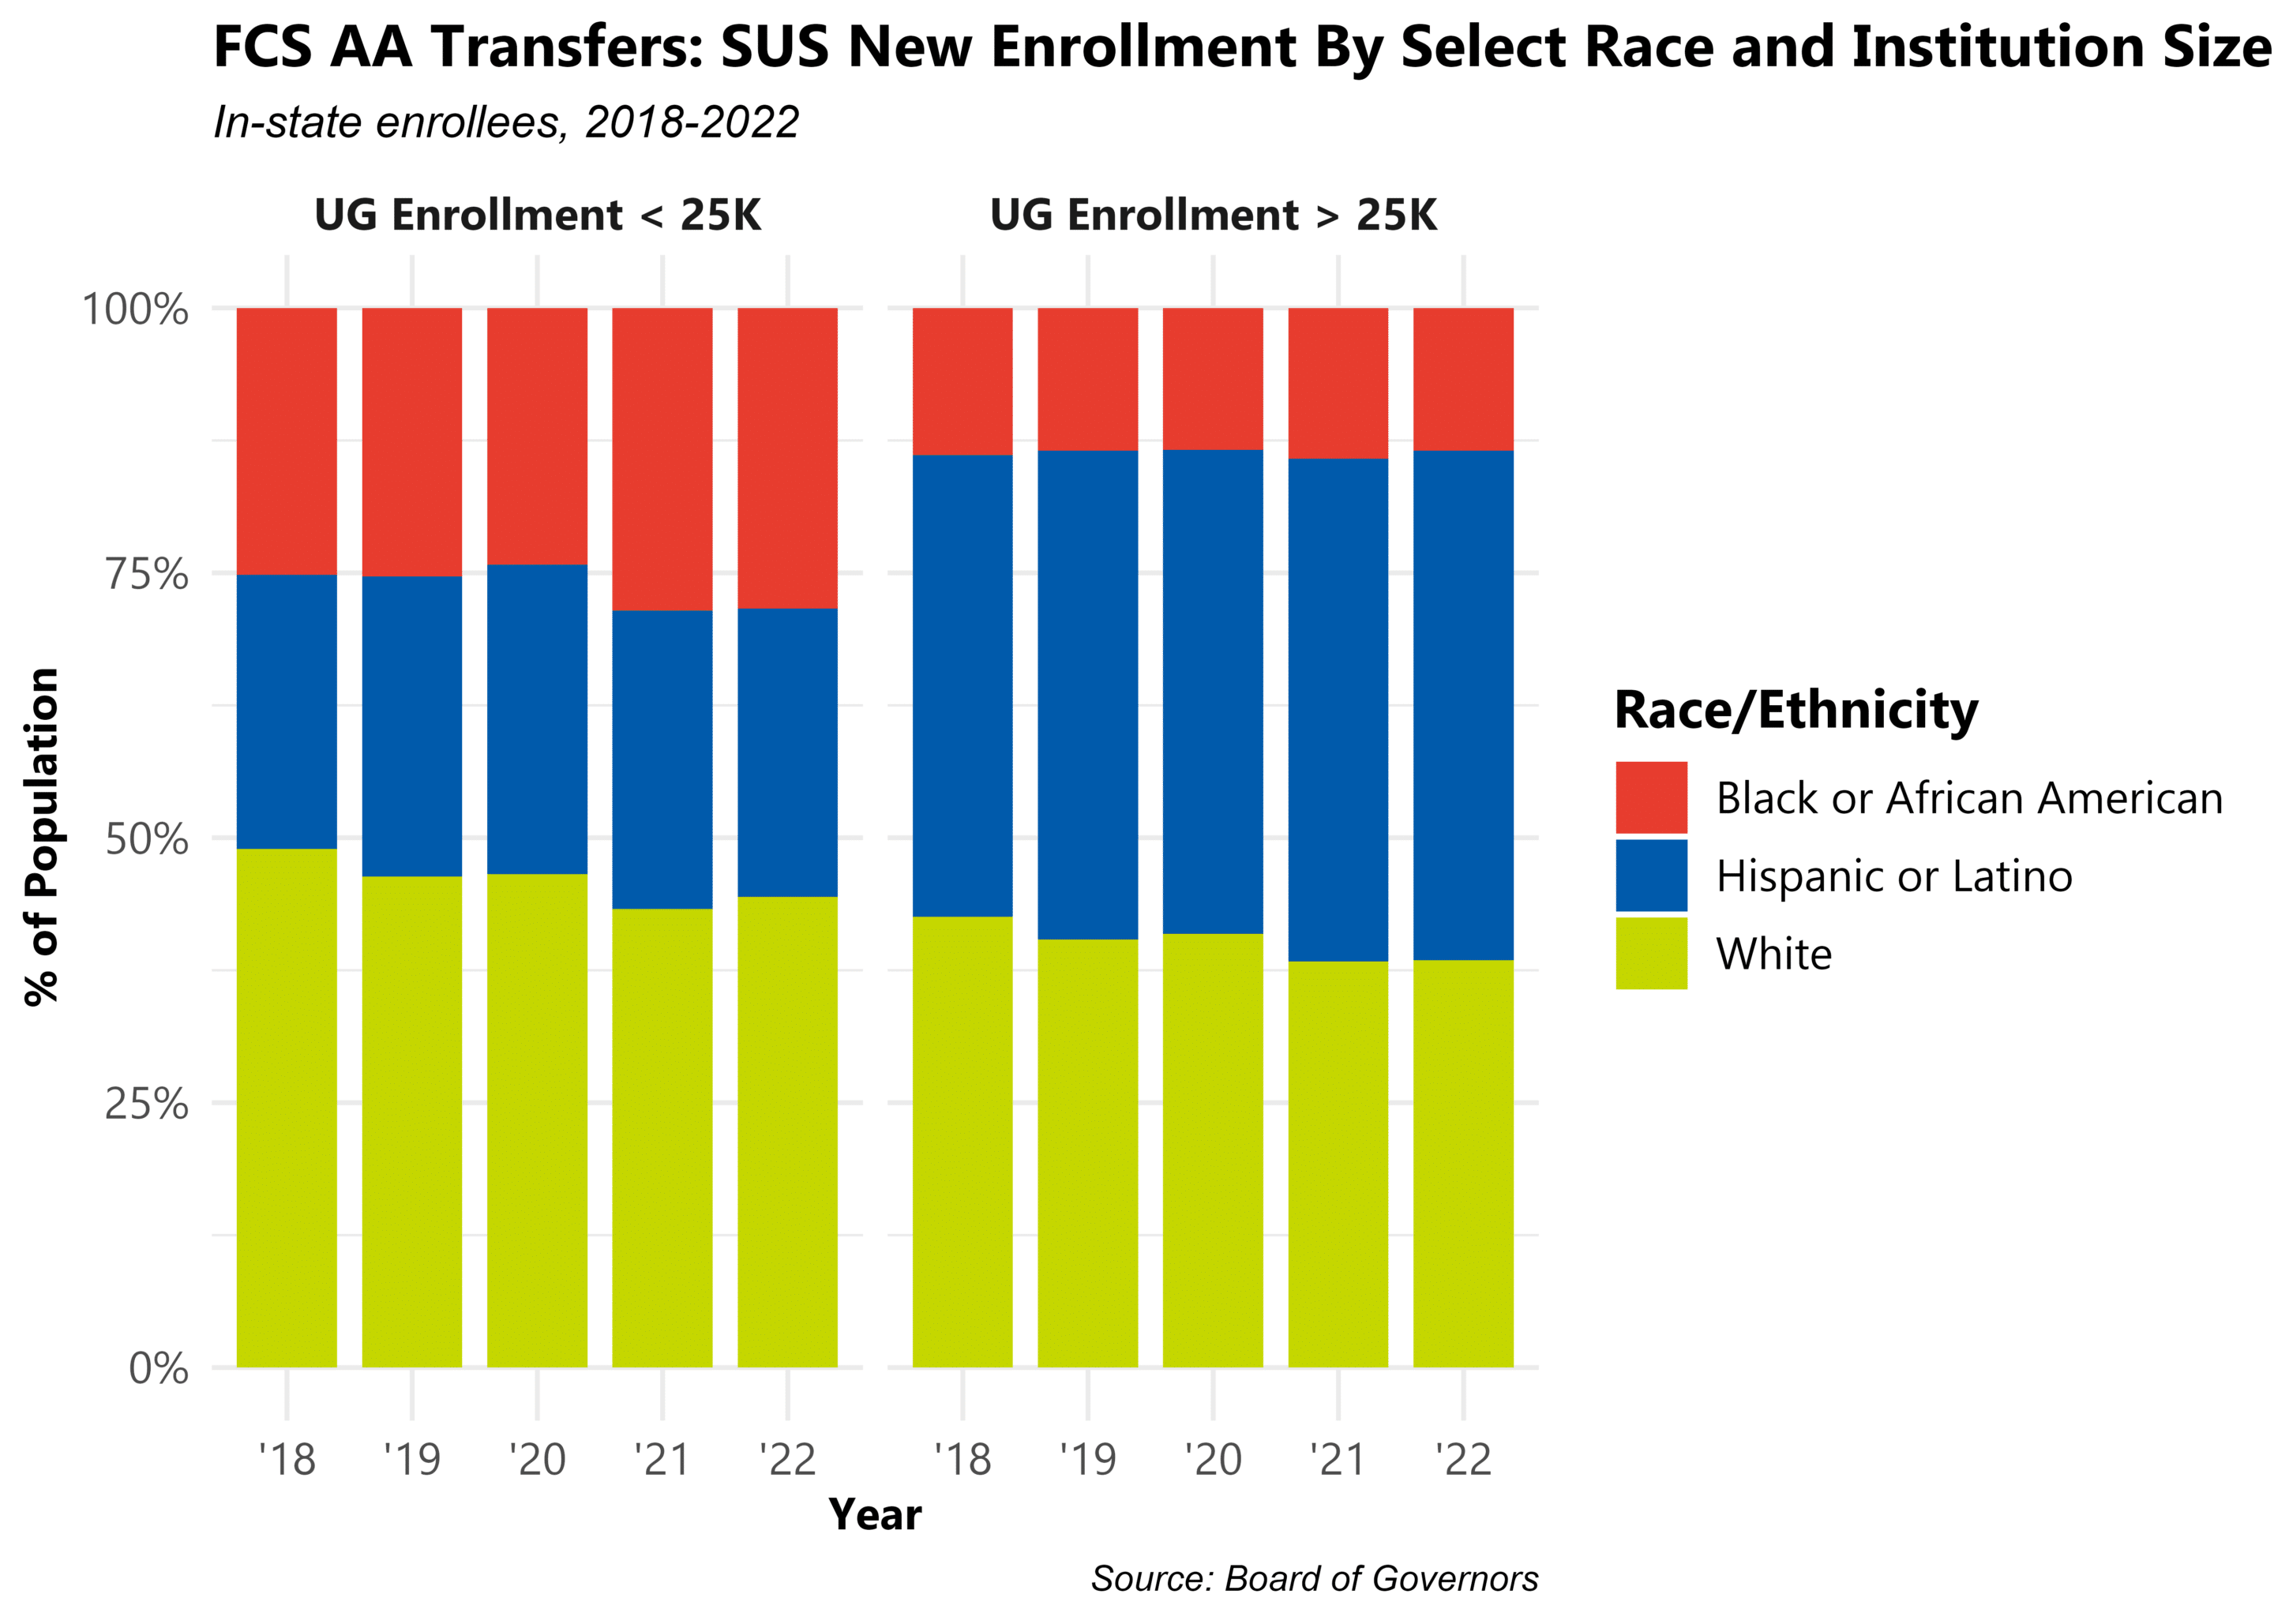
FCS AA Enrollment: Institution Size and Race
Analyzing FCS AA students alone, a significantly greater Hispanic population exists at large SUS schools; in SUS schools with less than 25,000 undergraduates enrolled, the proportion of Black transfer students is notably larger than the SUS-wide aggregate value.
- Potentially contributing to this is the presence of the country’s largest Hispanic Serving Institution (FIU) in the >25,000 Undergraduate enrollment cohort and a nationally popular Historically Black College and University (FAMU) in the <25,000 Undergraduate enrollment group.
Takeaways
As Florida continues towards the 2030 target of its Sail to 60 Initiative – 60% of working-age Floridians possessing a degree or career credentials – SUS and FCS institutions have created sustainable pathways for residents to obtain their degree from the excellent public colleges and universities present in the state.
This report reveals the Florida College System AA transfer students of SUS institutions to be more diverse in both ethnicity and age than their First Time In College counterparts. Both Black and Hispanic Floridian students hold higher shares of the transfer population relative to first time in college students, and the spread of age observed at the transfer level is wider than that of FTIC students across SUS institutions.
Despite increased diversity within the transfer student population, Black or African American students remain largely underrepresented in the SUS student body. In the decade from 2012-2022, there was an observed difference of 7.1 percentage points between 18-24 year old Black residents’ share of the Florida population and their representation among SUS undergrads. For comparison, Hispanic or Latino students saw a difference of 0.7 percentage points, and White students saw an increase of 1.2 percentage points from their Florida Census population share to their SUS representation.
With in-state SUS enrollment shares falling and smaller SUS schools targeting growth, transfer students are a population of interest, with both statewide and local articulation agreements forging a path from FCS to SUS. Of the five SUS schools with over 25,000 undergraduates enrolled, the three members of the Florida Consortium of Metropolitan Research Universities – UCF, USF, FIU – reported at least 35% of their new enrollment to be FCS AA transfers; the remaining two universities – FSU and UF – reported less than 25% of their new enrollment to be transfers.
FCS institutions offer a space where students can tailor their post-secondary experience at a greater scale than SUS institutions. Guaranteed acceptance programs like FUSE ensure that students can adequately prepare – academically, financially, or professionally – to enter larger universities and succeed. Often, these enrollees are first-generation or non-traditional students who may have faced additional barriers to success had they entered an SUS institution as a First Time in College student.
Data Notes
This report examines recent SUS enrollment trends of Florida-resident first time in college (FTIC) and FCS AA transfer (FCS AA) students. It is the first of a two part series documenting both aid and demographic patterns of transfers to SUS institution. Part I provides a high-level glance at ethnicity and age population shares. Subsequent reports detail overall aid trends then further separates SUS institutions into two size-based cohorts to compare FTIC aid sources with FCS AA aid sources.
The Florida Board of Governors, the governing body of the SUS, provided two distinct and deidentified datasets detailing 1) the demographic characteristics and 2) financial aid information for enrollees disaggregated across their 12 member institutions.
Data is collected during the Fall term in each of the defined years (2018-2022) and tracks newly admitted Florida residents; the undergraduate students captured in the following report are either FTIC or FCS AA in-state enrollees. In this report, in-state refers to students who are living in the state and qualify for in-state tuition rates at Florida public post-secondary institutions.
Academic information such as Enrollment Pathway (FTIC vs FCS AA) and credits attempted are crossed with demographic information including age cohort, sex, and race/ethnicity. FCAN focuses on Black/African American, Hispanic, and White students, who represent over 90% of Florida residents aged 18-24. Unlike the federal standard of reporting race and ethnicity as separate demographic categories, Florida education data standards combine race and ethnicity. In this report, Hispanic students may be of any race, and values reported by race (White or Black) represent non-Hispanic students of that race.
Financial aid information reveals dollar amounts, recipient counts, and award categories for all aid disbursed at the defined institution
Supplemental data was sourced from both the U.S. Census Bureau (Census) and the National Center for Education Statistics (NCES) to illustrate the changing environment at SUS institutions. The Census provides demographic information for Florida’s 18-24 year old cohort. NCES introduces demographic shares for the entire SUS undergraduate population, in addition to capturing the in-state share of the first-time, full time undergraduate population.