
Florida’s newly enrolled transfer students at public universities receive less than 25% of the over $200 million in financial aid disbursed yearly.
FCAN examined the financial aid trends of Florida College System transfer students who hold AA degrees (FCS AA) attending Florida’s public universities. The analysis includes Florida-resident, full-time, first-in-college (FTIC) students and full-time FCS AA transfer students enrolling at any of the 12 State University System institutions. All students observed received federal, state, or institutional aid in the form of scholarships, loans, or grants. Private aid was included, but makes up less than 6% of the disbursed aid recorded over the evaluation period 2018-2022.
This report is the second of a two-part series documenting both aid and demographic patterns of Florida transfer students.
Aid
Despite flat in-state tuition and fees over the past decade, the cost associated with attending university – as a commuter or residential student – has grown substantially. Aid programs available for both FTIC and FCS AA students include:
- Scholarships: Awards to students which are outright (require no repayment in service or cash) and are based on skills and academic attainments as a means of determining recipients.
- Grants: Awards that are made outright (require no repayment in service or cash) and are typically need-based.
- Loans: Borrowed money that must be repaid with interest.
- Student Employment: Student work opportunities such as the College Work/Study Program, Student Assistantships, or any other type of student employment at the institution.
Aid: Total Dollars by Pathway
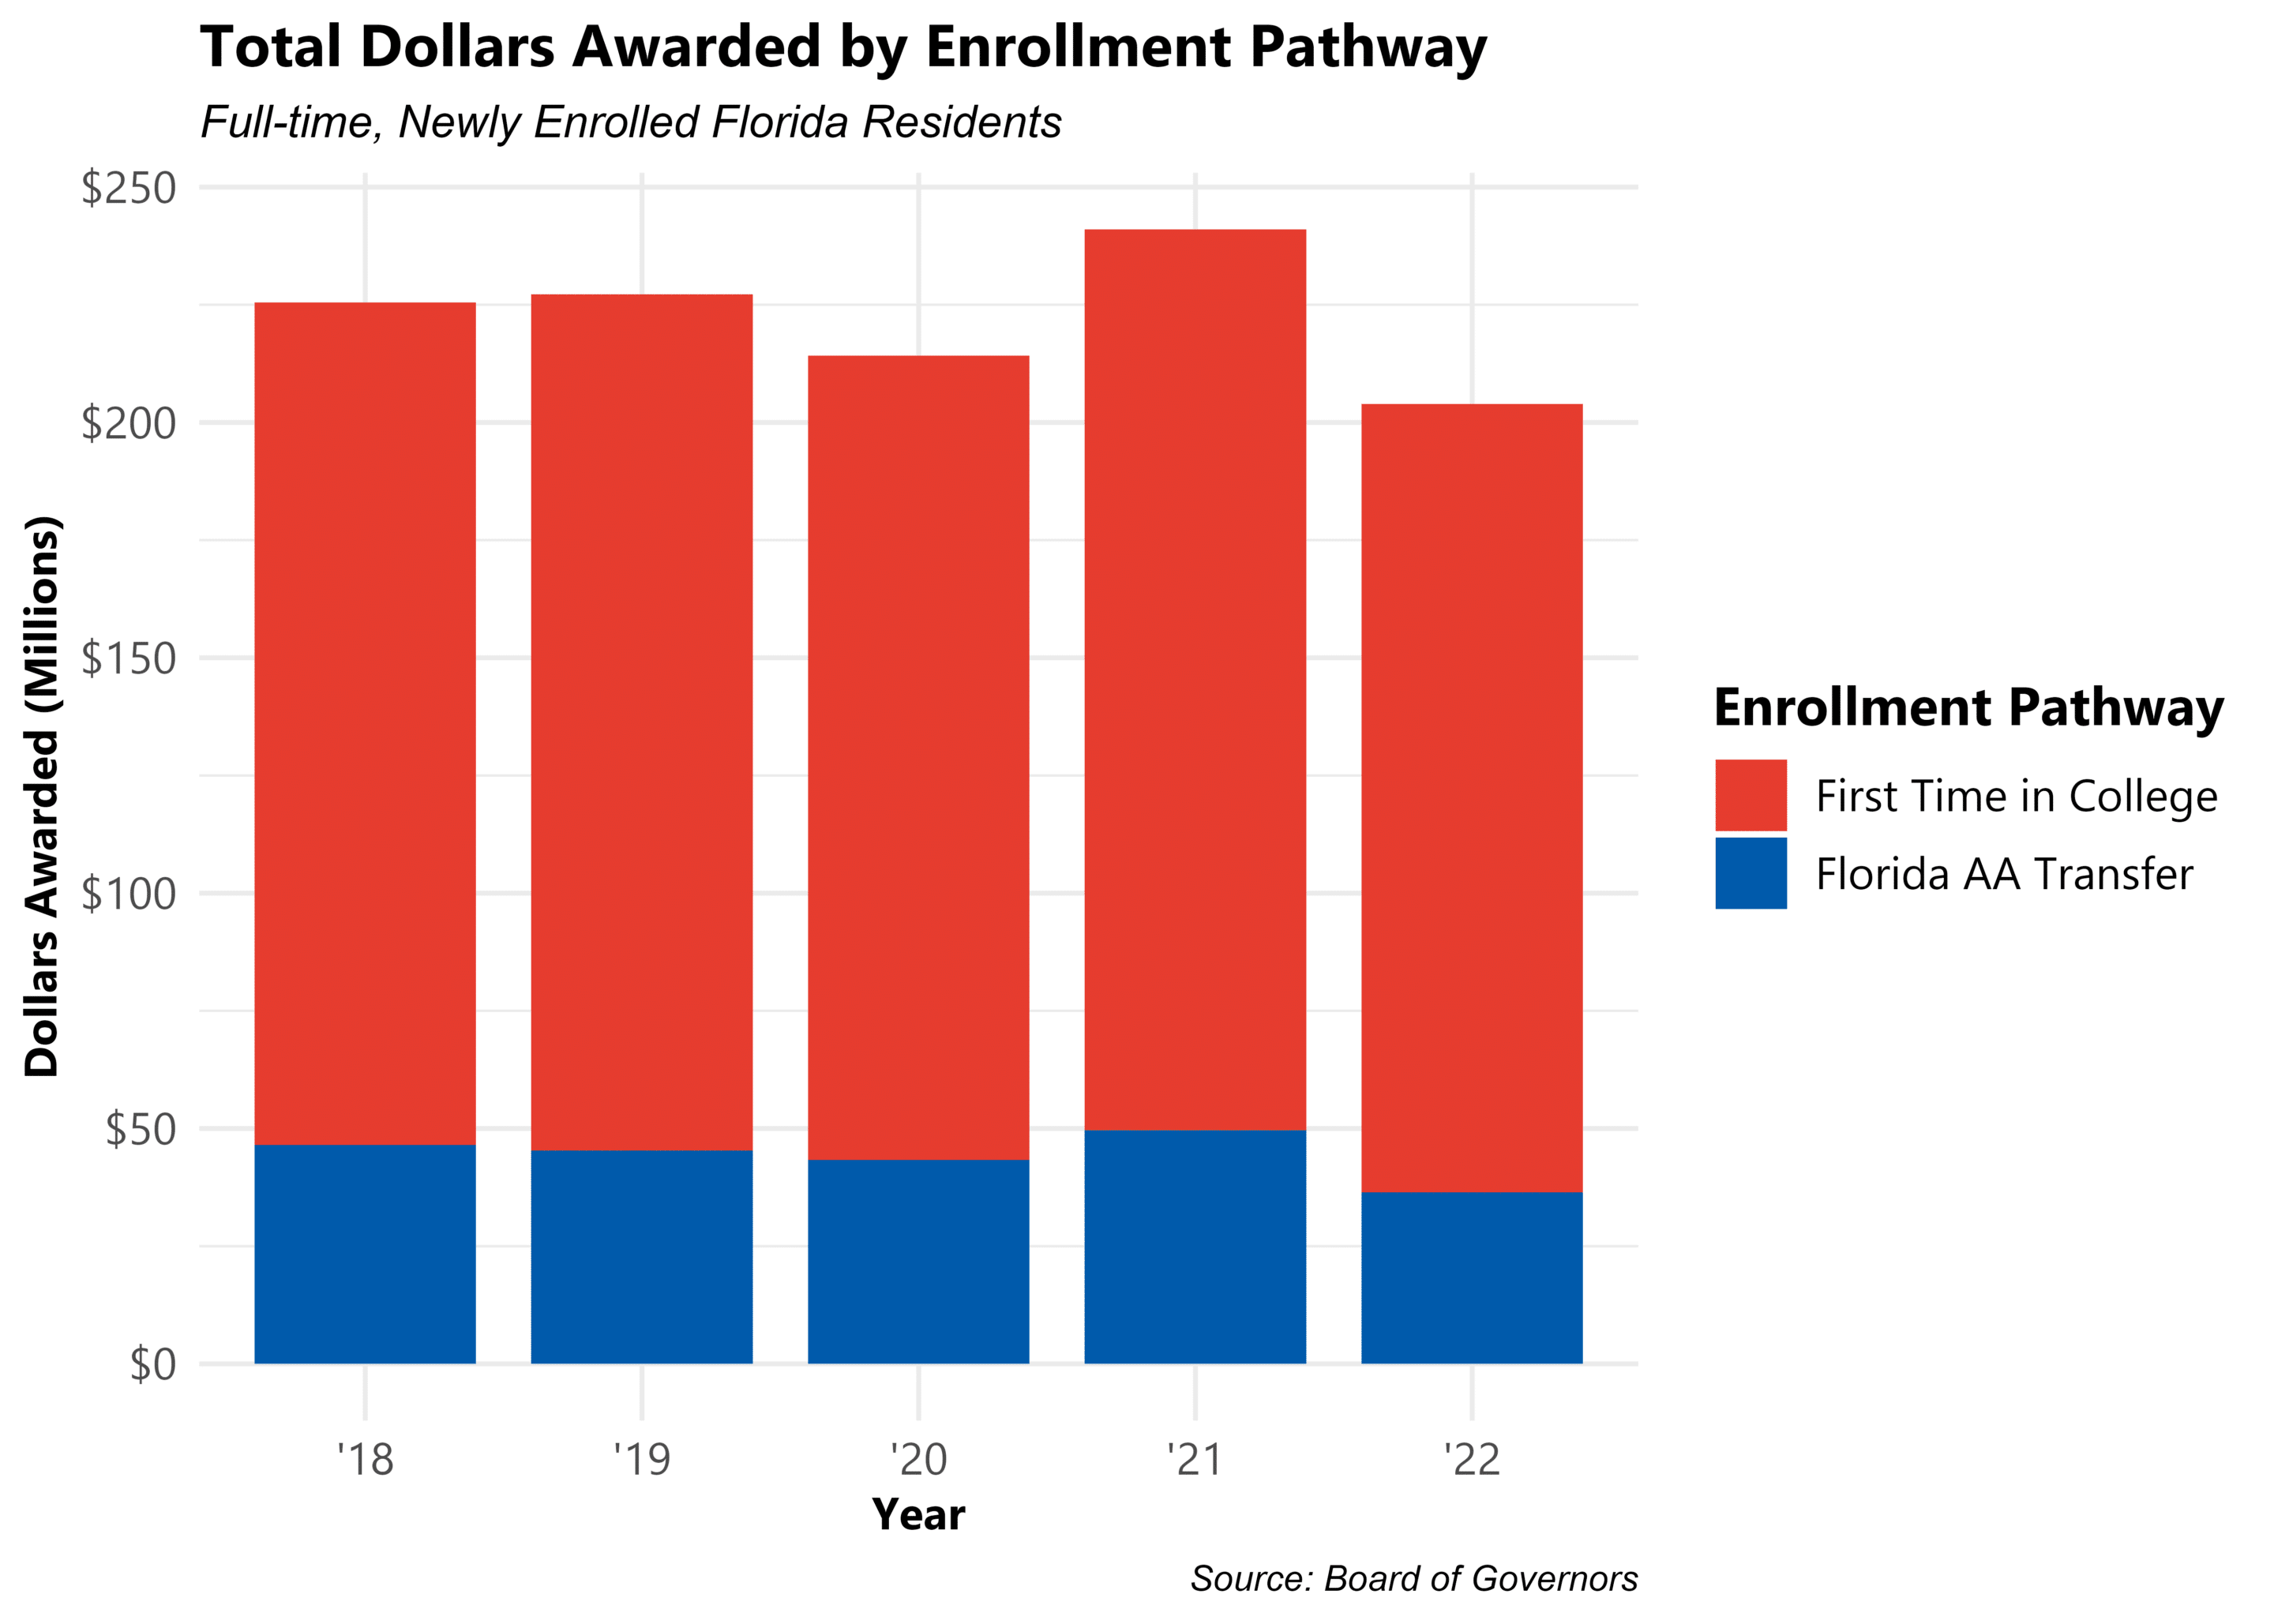
The share of aid dollars disaggregated by enrollment pathway follows the enrollment trend for both groups observed in Part I, remaining largely stable for the evaluation period of 2018-2022. A post-pandemic spike representing the injection of emergency federal aid can be seen in 2021 before aid decreases to pre-Covid values.
- While FCS AA students represent a third of newly enrolled Florida residents from 2018 to 2022, they receive less than a quarter of the over $200 million in aid disbursed.
Aid: Dollars per Credit Hour by Pathway
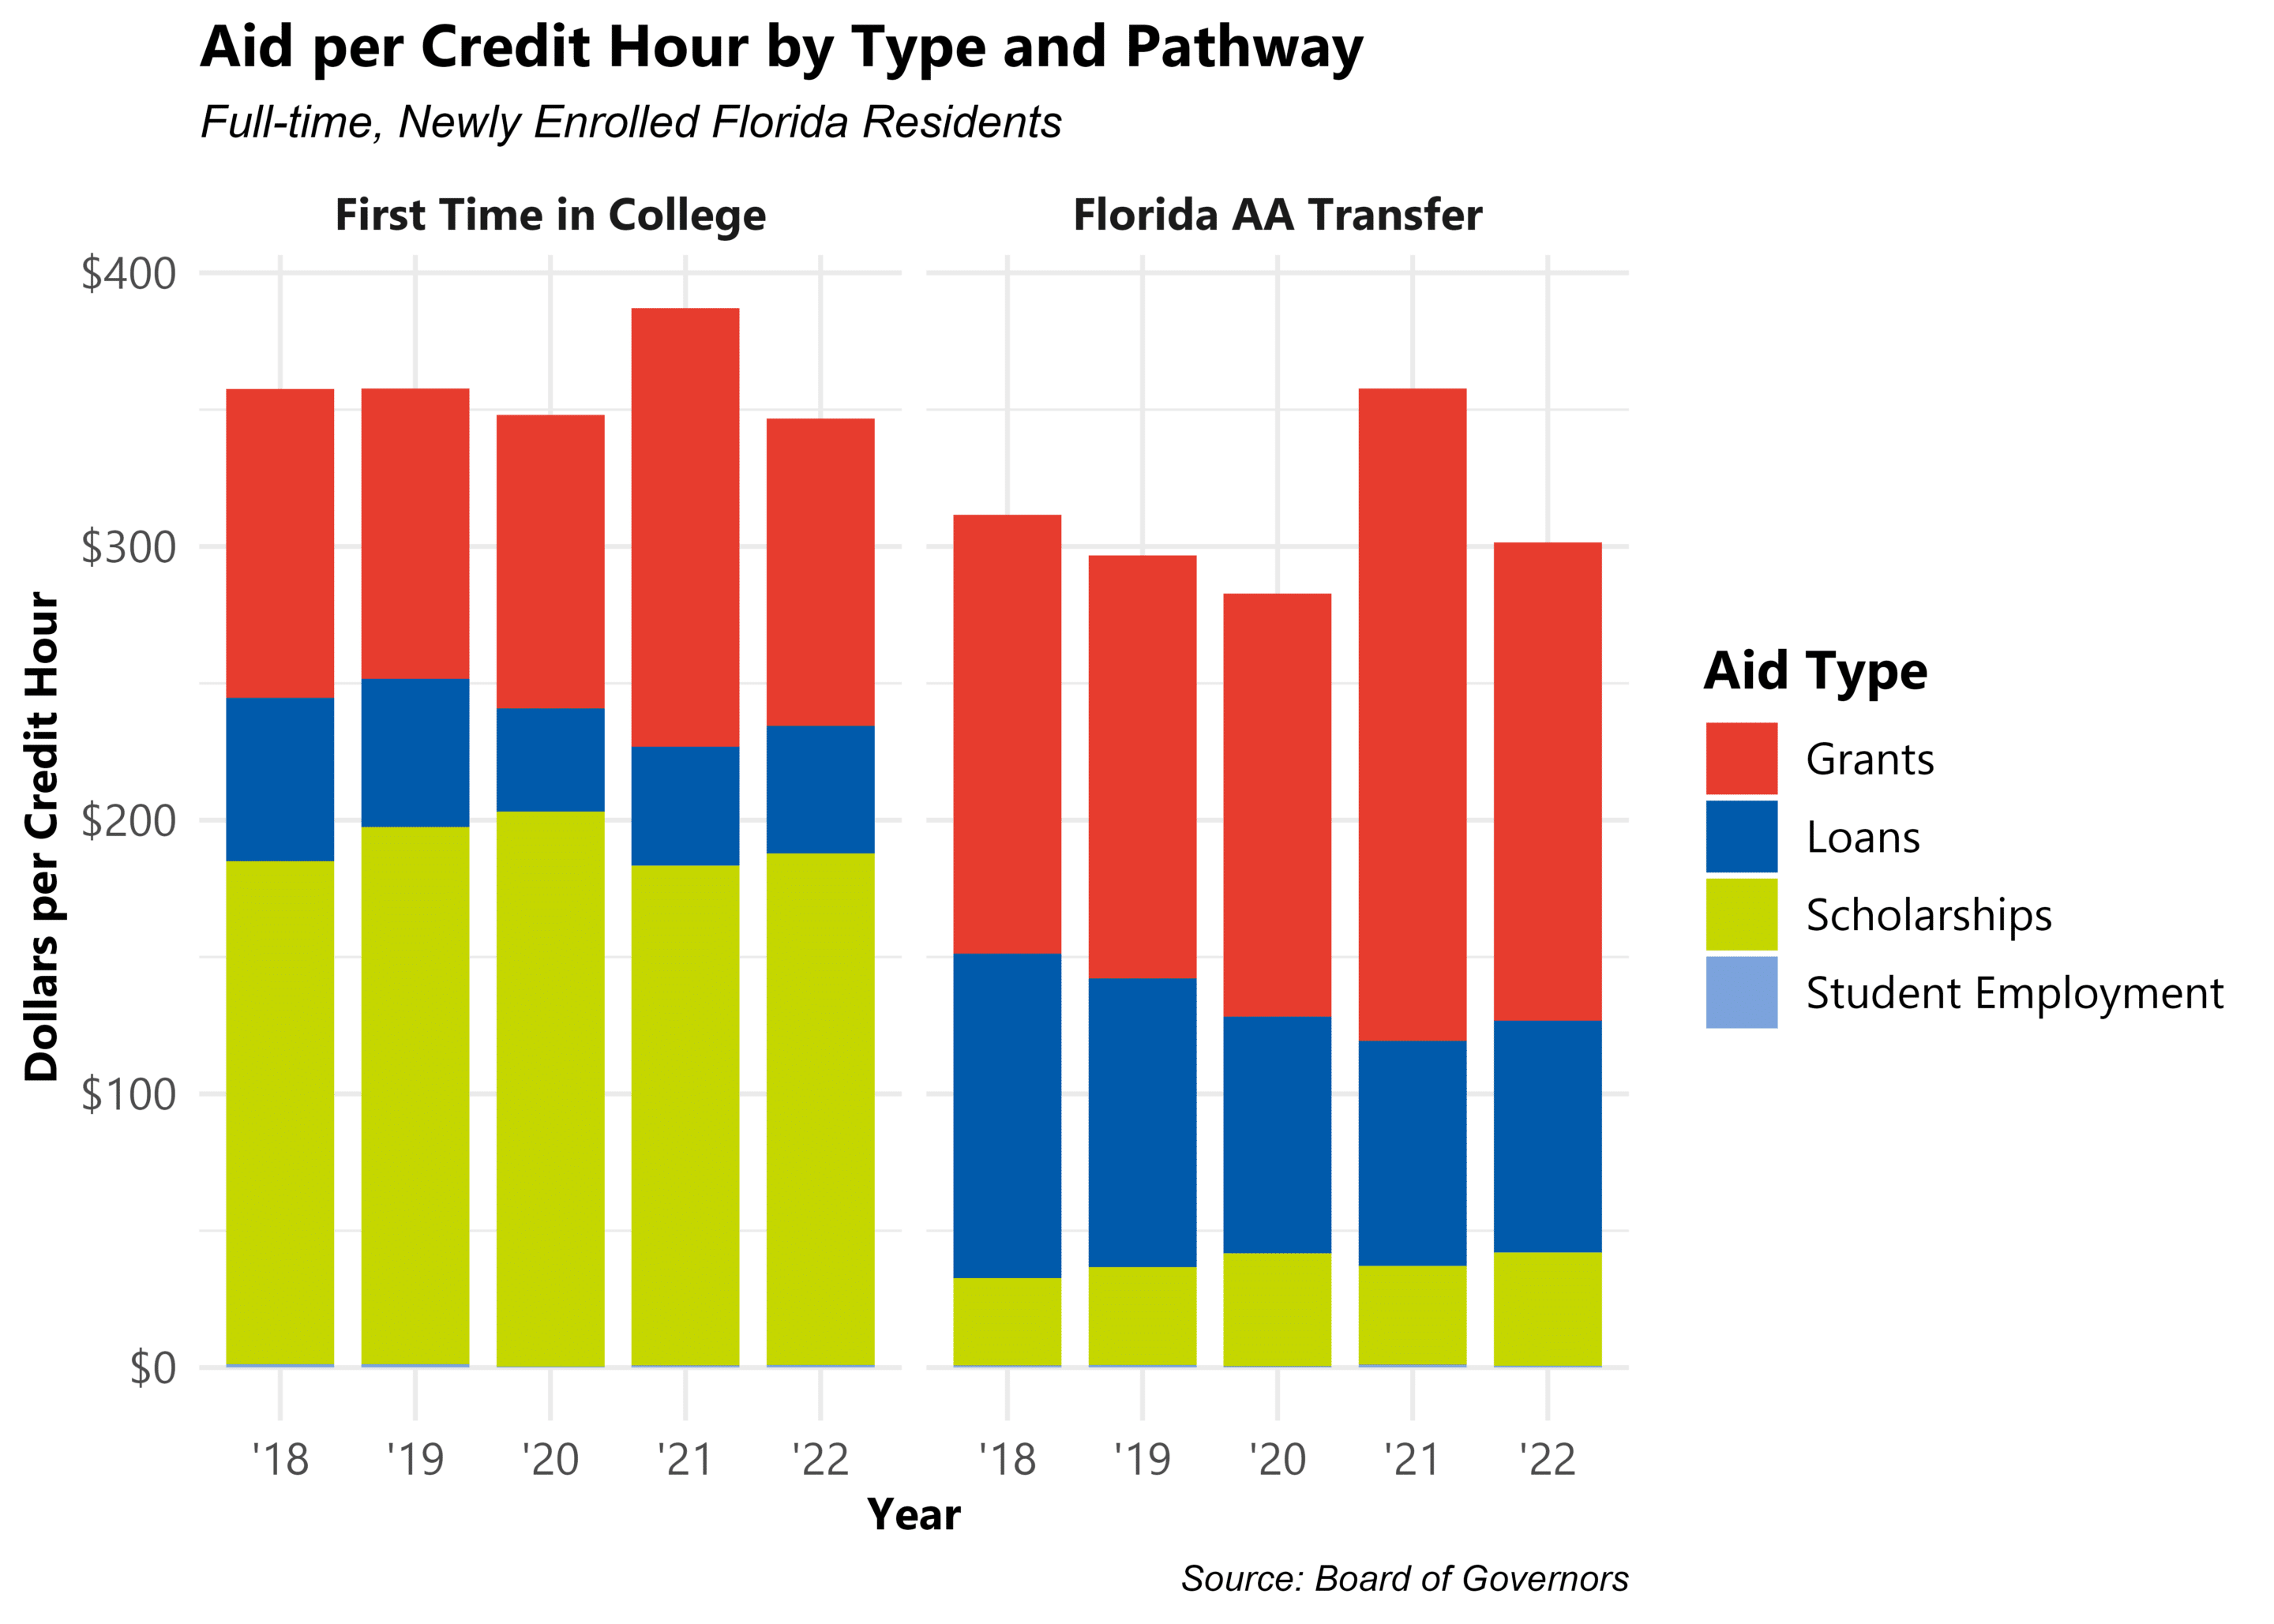
To appropriately compare across SUS institutions with varying student populations receiving aid, Aid Per Credit Hour represents the total aid dollars disbursed for an evaluation year over the total hours attempted by the newly enrolled cohort.
- Aid for newly enrolled Florida residents – whether FTIC or FCS AA – stagnated over the past five years, even suffering a slight decline before the injection of emergency aid dollars in 2021.
- On average, the cohort of FCS AA students receive roughly $50 less aid per attempted credit hour than their FTIC counterparts.
- Aid packages take a different shape depending on enrollment pathway
- FTIC students’ aid packages are largely scholarships, averaging 50% from 2018-2022, followed by grants at over 30%. Both types of aid do not require repayment. Loans represent less than 15% of FTIC aid for all years.
- Over the evaluation period, FCS AA students saw the share of their aid packages built on loans requiring repayment decrease from over 35% in 2018 to around 25% in 2022. Scholarships (below 15% for all years) and grants (ranging from 50% to 65%) are the remainder.
Aid: Grant Dollars
The largest source of aid for FCS AA transfers, grant dollars, can come from state and federal government, as well as the institution itself. For four of the five evaluation years, over 80% of grant dollars awarded to FCS AA transfer students were either Pell Grants or Florida Student Assistance Grants.
- Pell Grants, are federal grants awarded to undergrad students displaying exceptional financial need and have not earned a credential beyond an associate degree.
- To receive information on eligibility and award amounts, students must complete the FAFSA each year they’re enrolled in a qualifying program.
- The maximum Pell award amount for the 2024-2025 award year is $7,395
- Florida Student Assistance Grants are need-based state grants for Florida residents attending SUS and FCS institutions as undergraduate students.
- Financial need is demonstrated by completing the FAFSA for all years enrolled in a qualifying institution.

Aid: Total Dollars by Pathway
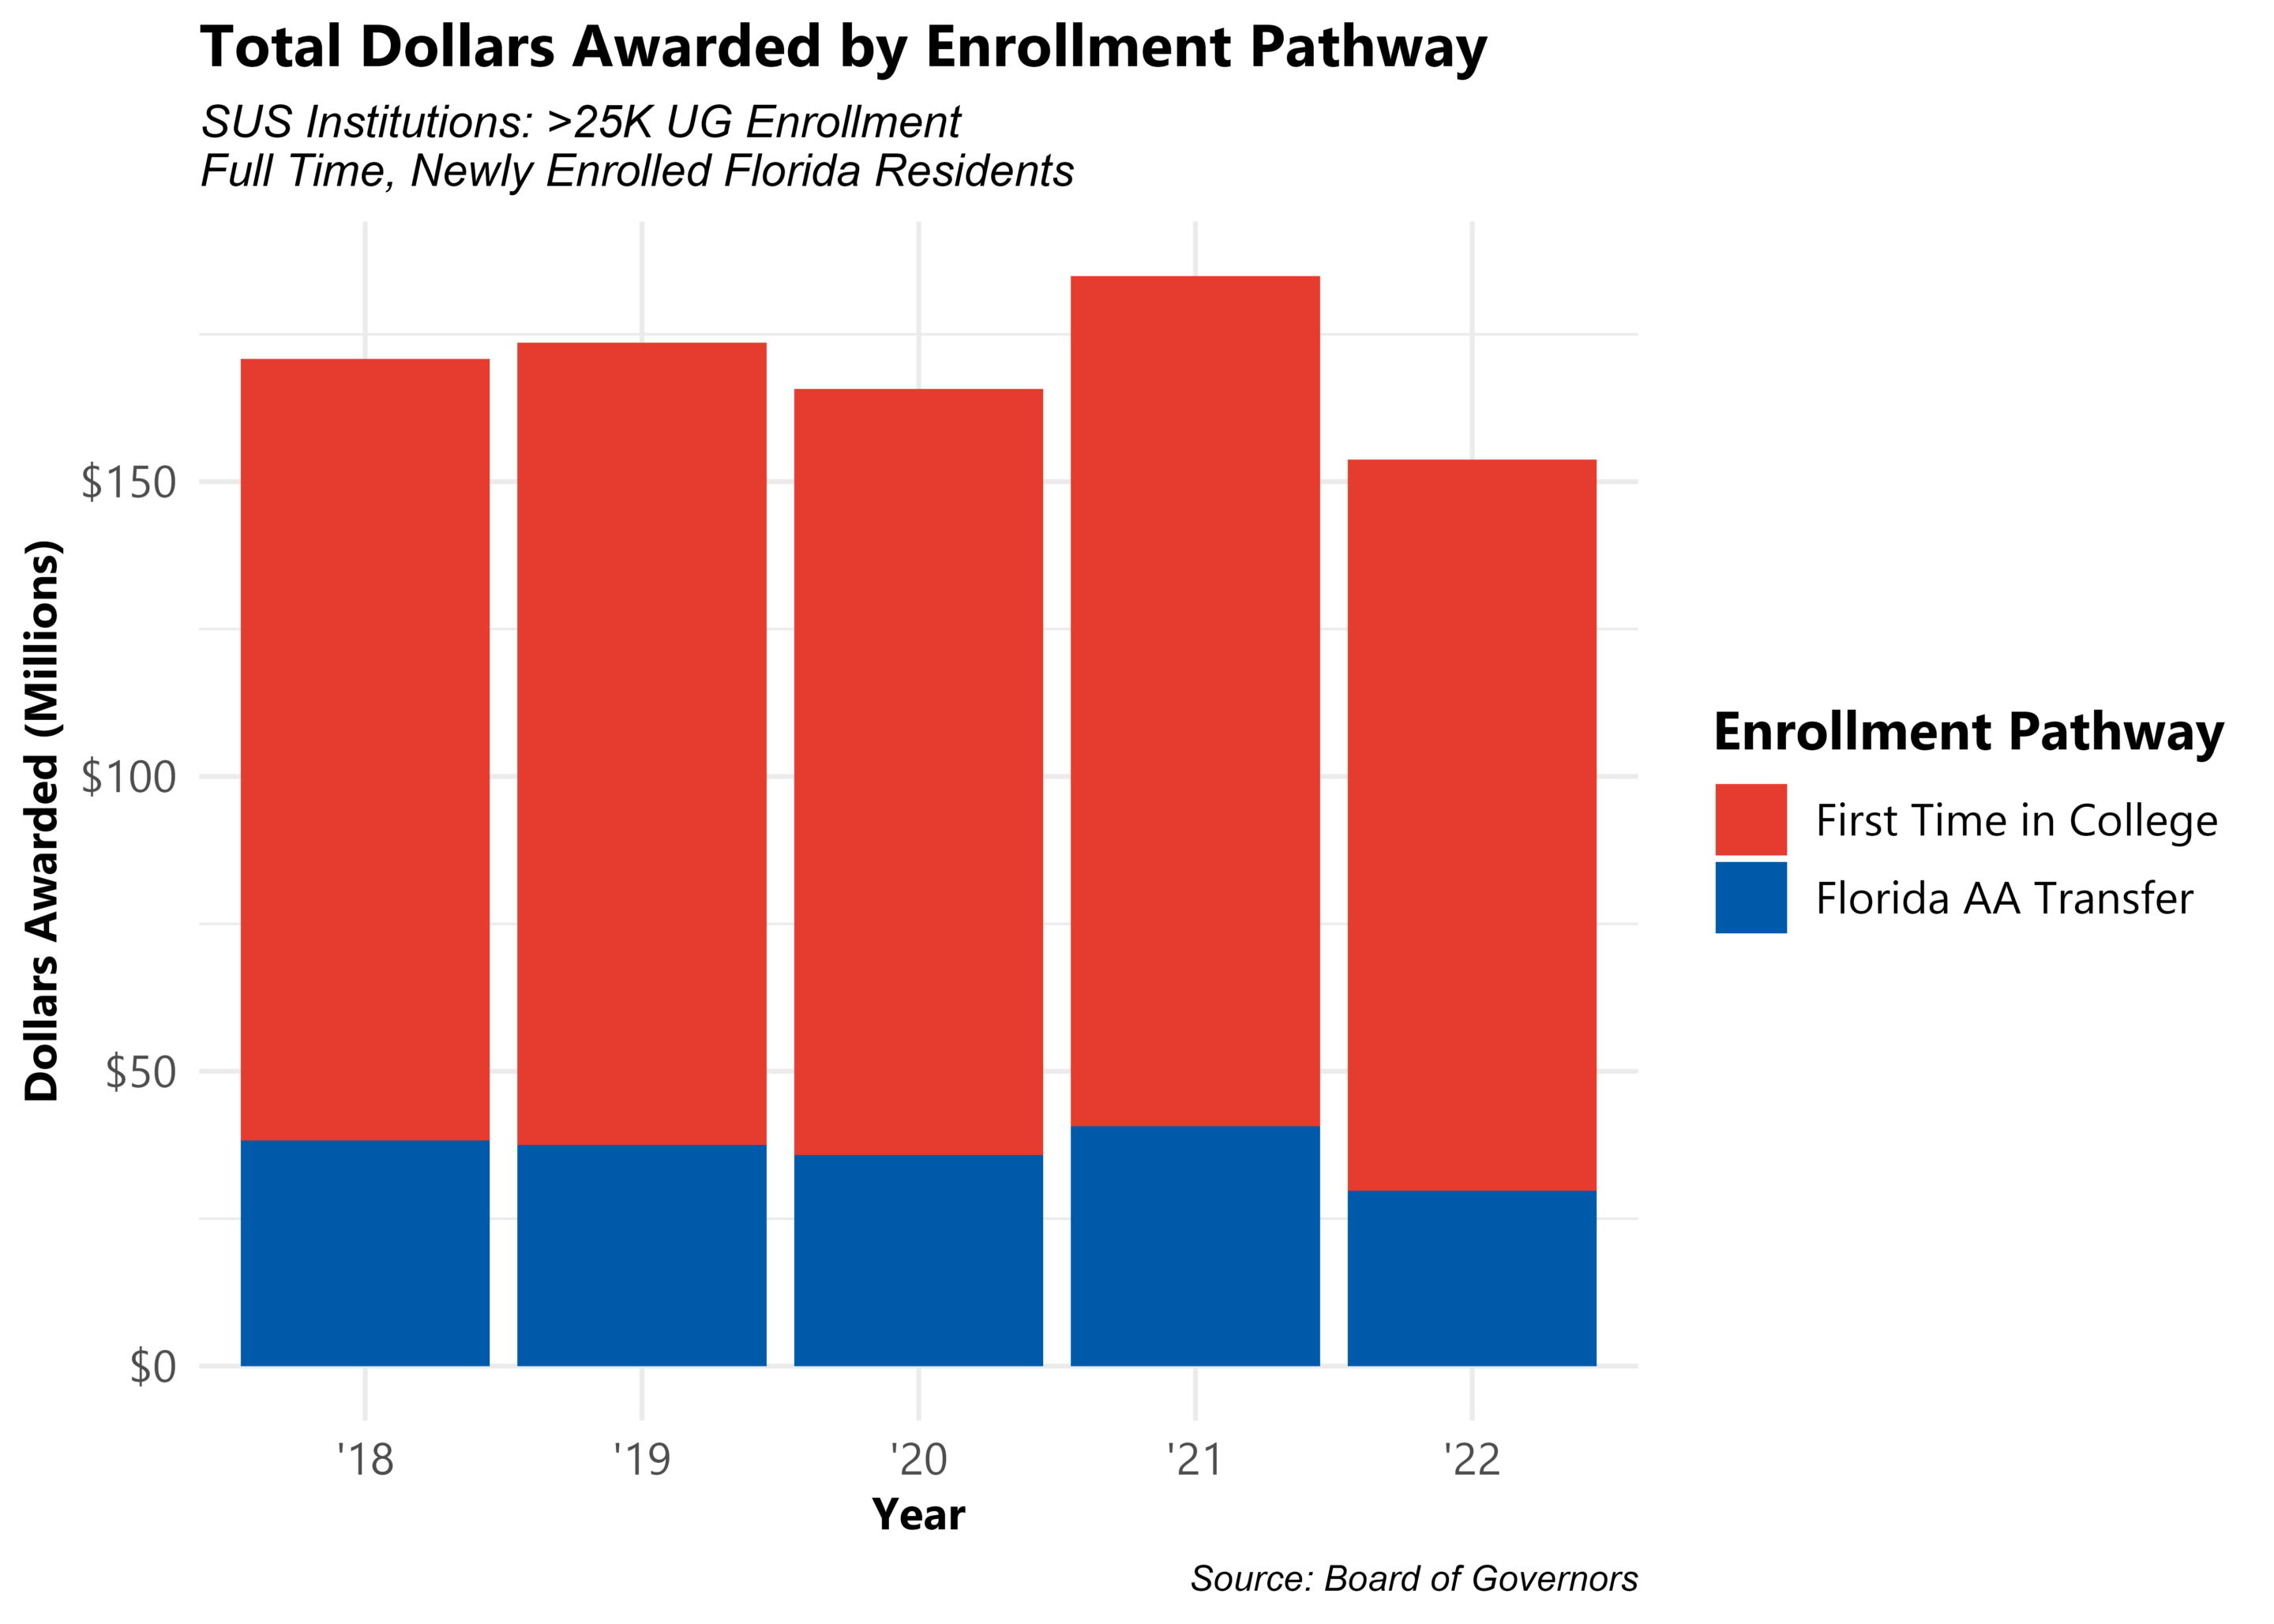
Dividing SUS institutions into the same size-based cohorts as Part I, aid patterns reflect enrollment trends.
- Larger institutions, enrolling more transfer students, see their transfer population receive more aid in comparison to institutions with less than 25,000 undergraduates. FCS AA students at these five schools collected at least 25 million dollars of the minimum 150 million available in each of the evaluation years.
- The seven SUS remaining SUS institutions’ FCS AA students received less than a fifth of the disbursed aid in the same period.
- At schools above and below the 25,000 undergraduate threshold, neither FTIC nor FCS AA aid to new enrollees experienced substantial growth during the evaluation period. Following the 2021 spike attributed to post-Covid Emergency Federal Aid, schools largely returned to their pre-Covid aid levels.
See Per Credit Hour Details Below.

Aid: Grant Dollars by Pathway
Institutional grants, aid dollars awarded directly from an institution to students for education expenses, are typically means-based. The gap in institutional grant dollars awarded to FTIC students and FCS AA students increased in favor of FTIC students from 2018-2020. Following the pandemic, FCS AA students saw a substantial rise in their share of grant dollars.


Per Credit Hour Details
- FTIC aid ranged between $350 and $400 per credit hour attempted (by newly enrolled cohort) from 2018-2022 among the cohort of SUS institutions with more than 25,000 undergraduates enrolled, the median lying at $366 over the 5-year period. FCS AA aid declined within that institutional cohort before the 2021 anomaly, with a median value of $302 per credit hour from 2018-2022.
- Among the cohort of SUS institutions with fewer than 25,000 undergraduates enrolled, the gap in PCH aid narrows, with the median FTIC value of $315 just greater than the FCS AA median of $296.
- In both cohorts, we observed a wider spread in the aid dollars disbursed to FCS AA transfer students.
- At the 5 largest SUS institutions, FTIC PCH aid lies above $325 for the entirety of the evaluation period, peaking at $450. FCS AA PCH aid for the same schools lies below $325 for most of the period, with the minimum below $250. 2021’s emergency aid dollars bring FCS AA PCH aid to its peak of nearly $400, before decreasing to more familiar levels in 2022.
- In this cohort, UF displayed the highest average PCH aid for FTIC students over the period, $392; UCF exhibited the highest average PCH aid for FCS AA students at $330.
- PCH aid at SUS institutions with undergraduate enrollment below 25,000 showed a similar 2021 spike, but both FTIC and FCS AA aid are concentrated around lower values. FTIC PCH aid typically lies between $225 and $325, outside of FAMU, which peaks at nearly $600. FCS AA aid has a larger spread, but the majority of observations lie in the same range as FTIC aid, outside of outliers like FAMU and NCF, both peaking above $500 in 2021, and FPU, falling below $200 in 2022.
- FAMU holds the highest average PCH aid value for both FTIC and FCS AA students in the <25,000 UG enrollment group – $513 and $402, respectively.
- At the 5 largest SUS institutions, FTIC PCH aid lies above $325 for the entirety of the evaluation period, peaking at $450. FCS AA PCH aid for the same schools lies below $325 for most of the period, with the minimum below $250. 2021’s emergency aid dollars bring FCS AA PCH aid to its peak of nearly $400, before decreasing to more familiar levels in 2022.
Policy Implications and Future Research Opportunities
As Florida continues towards the 2030 target of its Sail to 60 Initiative – 60% of working-age Floridians possessing a degree or career credentials – SUS and FCS institutions have created sustainable pathways for residents to obtain their degree from the public colleges and universities present in the state.
This report reveals the resident transfer student population of SUS institutions receive less than a fourth of the total aid distributed to newly enrolled students, despite accounting for a third of the cohort. Beyond receiving less aid, Florida College System AA Transfers receive their support from different sources than first time in college students; grants and loans accounted for over 75% of FCS AA transfers’ aid packages in all of the evaluation years, whereas scholarships were the plurality of aid received by FTIC enrollees. While grants are a mix of need and merit-based awards, loans typically require repayment – a significant factor weighing into Floridians’ postsecondary decisions.
Affordability has long been a barrier to access for Floridians considering postsecondary education. Florida’s merit-based Bright Futures scholarship program provides tuition aid, but offers students limited relief when considering the additional costs of attending any type of postsecondary institution. Whether choosing to commute or reside on or near campus, the cost of living can prove to be a serious hurdle in completing one’s credential.
FCAN’s recent report The Real Cost of College in Florida examines four example situations and illustrates the various cost challenges students face at different stages of life and varying levels of aid. The conclusions remain consistent across scenarios: Florida students would benefit greatly from a stronger emergency aid infrastructure and expanded funding for the state’s primary need-based grant, the Florida Student Assistance Grant (FSAG).
Importantly, this two-part transfer student analysis lends itself to calls for improving the statistical reporting capacity of the state. An array of actors including researchers, policymakers, parents, and students each have a stake in data-informed decision making.
An enhanced Statewide Longitudinal Data System (SLDS) that improves public access to data would serve this purpose—tracking students from early learning through workforce outcomes across socioeconomic characteristics. For example, the ability to observe aid distribution by academic pathway could inspire policy options for improving high-value program completion and, ultimately, career success. Improving higher education’s data infrastructure – and increasing access to it – would allow Florida to leverage the research capacity within the community aimed at informing how we can improve the postsecondary education experience for students.
Data Notes
The Florida Board of Governors, the governing body of the SUS, provided two distinct and deidentified datasets detailing 1) the demographic characteristics and 2) financial aid information for enrollees disaggregated across their 12 member institutions. FCAN conducted the calculations resulting in the visualizations seen in this report.
Data is collected during the Fall term in each of the defined years (2018-2022) and tracks newly admitted Florida residents; the undergraduate students captured in the following report are either FTIC or FCS AA in-state enrollees. In this report, in-state refers to students who are living in the state and qualify for in-state tuition rates at Florida public postsecondary institutions.
Academic information such as Enrollment Pathway (FTIC vs FCS AA) and credits attempted are crossed with demographic information including age cohort, sex, and race/ethnicity. FCAN focuses on Black/African American, Hispanic, and White students, who represent over 90% of Florida residents aged 18-24. Unlike the federal standard of reporting race and ethnicity as separate demographic categories, Florida education data standards combine race and ethnicity. In this report, Hispanic students may be of any race, and values reported by race (White or Black) represent non-Hispanic students of that race.
Financial aid information reveals dollar amounts, recipient counts, and award categories for all aid disbursed at the defined institution. These recipient counts are unique within an individual award, but students can receive multiple awards in their aid package.